- Data Analytics and Trading Systems in Stock Market
Data Analytics in Stock Market

Disclaimer: The content of this page is provided to facilitate the conceptual understanding of stock market trading and investing. It does not constitute advice, or a recommendation, to buy, trade or invest in stocks or any other tools such as futures and options. If you decide to trade, you may be taking on risk for which there is no recourse. इस पृष्ठ का मूल उद्देश्य शेयर बाजार में क्रय और विक्रय का और निवेश की वैचारिक समझ को सुविधाजनक बनाना है। यह स्टॉक या वायदा और विकल्प जैसे किसी अन्य उपकरण को क्रय-विक्रय करने, व्यापार करने या निवेश करने की सलाह या अनुशंसा नहीं है। यदि आप क्रय और विक्रय करने का निर्णय लेते हैं, तो आप जोखिम उठा रहे होंगे जिसका कोई सहारा नहीं है।
Table of Contents: Option Stop-Loss Calc |-Risk-Reward Ratio |-Magic of Compunding -|- Options Basics |-Passive Income |-| Land Measurement System |=| Fundamental Analysis |-Market Frauds |-Loan EMI Calc ]-[ Option Delta Calculator |-Asymmetry in Option Pricing |:| Net return on Investments |:| Historical Return on NSE |:| Propaganda of Value Erosion |*| Scraping of NSE Website |*| Weightage of stocks in NIFTY50 [*] Get Equivalent Lot Size of a Portfolio |*| Public Provident Fund |*| Gratuity [:] Buying a House [:] Story of Boom and Doom in Charts [:] Kaithi Script
सकारात्मक दृष्टिकोण: Manifestations


Basics of stock market trading
It is negative-sum activity!
There is a PANIC seller, there is a GREEDY buyer!
There is a GREEDY buyer, there is a PROFIT-Making seller.
These statements may look mysterious, foolish or obvious, the fact remains that money only changes hands in the stock market. Though, if trades are evaluated over a long term, half trades [and not traders] shall be winners and remaining half shall be losers. Note that wealth destruction does happen but by company operations and not in trading. Despite 98% value erosion in Suzlon and Yesbank - traders have made huge profits.Golden Rules of Trading: note it is called "golden rules" and not "assured return" rules
- Do not pay attention to market headlines* such as investor lost "X lakh crores"...
- Decide exit strategy [stop-loss or book-profit] at the time of entry only
- Make yourself a promise not to enter into a trade without (trailing) stop-loss
- Deploy only 75% of your capital - keep 25% for reverse trade during extreme volatility
- Put all effort to avoid Hope Trades - this will mentally drain you and lead to over-trade
- Learn to respect the momentum [moving averages are the simplest method to gauge momentum if you cannot infer momentum from price chart].
* Market crashes do not lead to loss of cash or money at the banks. Only the speculative trades on that and around that day result in losses (which happens in daily speculation).
Markets do not chase the Headlines, the Headlines chase the Markets!
क्षति-सीमा में प्रत्यक्ष सुरक्षा या नुकसान को नियंत्रित करने के साथ साथ कई अप्रत्यक्ष लाभ हैं। यह आपको खेल में बनाए रखता है, आपके दिमाग को पिछले नुकसानों से अव्यवस्थित नहीं करता है और आपको अनुकूल बाजार चाल के लिए प्रतीक्षा या प्रार्थना करने के लिए विवश नहीं करता है। यदि आपको हाल ही में (भारी) घाटा हुआ है या घाटा महीने-दर-महीने आगे बढ़ाया जा रहा है तो आप अच्छा व्यापार नहीं कर सकते। इससे विपरीत अनुकूल स्थिति उत्पन्न होने पर भी व्यापार करने में डर पैदा होगा। "लोहे की शक्ति" होने से प्रतिभूति विपणि या मण्डी में व्यापार में मदद नहीं मिलती है। हालाँकि बहुत सारे संयोजन संभव हैं, आप यहाँ वर्णित कुछ के आधार पर अपनी स्वयं की रणनीतियाँ विकसित करना पसंद कर सकते हैं: Stop-loss has many indirect benefit than direct protection or capping of losses. It keeps you in the game, does not clutter your mind with previous losses and does not make you wait or even pray for favourable market moves. You cannot trade well if you have recent (huge) losses or losses are being carried forward month after month. It will instil fear to make trade even if a more favourable situation arise. Having a "nerve of steel" does not help in stock market trading. While there are too many combinations possible, you may like to evolve your own strategies based on few described here:
[1]Keep stock selection different for different mode of trading: intra-day, swing, long term (> 5 years) [2]Do not track more than 50 shares and more than 5 industry segments - you may rotate the names keeping numbers under certain manageable limits [3]Invest in some high dividend yield stocks - over 10 to 15 years period, the effective yield may reach in lower double digits [4]Do not keep more than 2 trading accounts - better stick to one else you can keep one for trading and one for investment [5]Do not make a trade if you are concerned about brokerage and overhead costs [6]Note that stocks in your portfolio can provide margin money only for intra-day. For positions carried forward for many days, you will be charged high interest rate [as high as 18% per annum] by your stock broker [7]Keep 10% of available capital as back-up or buffer [8]Note that hedging always costs money that cannot be recovered [*]First thing last: learn the basics such as Trailing Stop-loss Order, Bracket Order, Circuit Limits, stocks in T2T Segments.
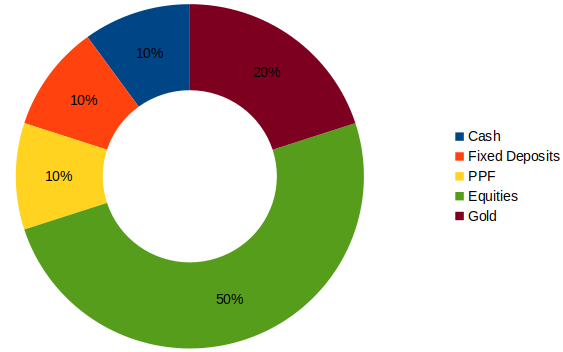
Many a time, one is tempted to make a "cover trade" to minimize the losses. For example, if you have sold a call option which turned out a loss-making trade, one tends to sell a put to cover some of the losses. It is better to book the loss and wait for favourable opportunity than to over-trade.One should not put all his capital into stocks. A sample distribution is shown below and you should select 5 segments of your choice and distribute investments as per near and far future cash requirements.
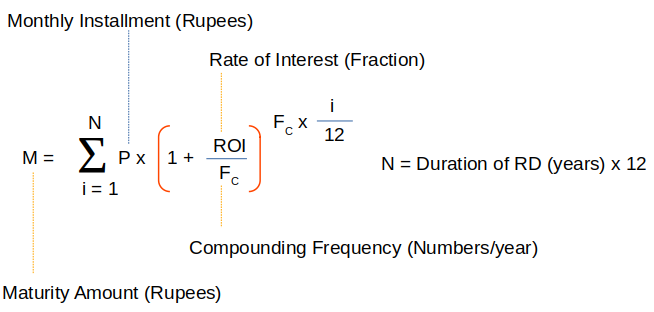
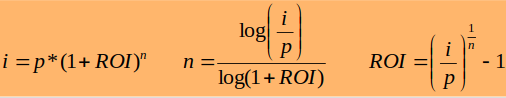
A good way to create a decent corpus is to create recurring deposit (RD). One may get distracted with low interest rate and erosion of value due to inflation. The purpose is to create a 'bulk' amount and not investment. While most financial institutions provide RD up to 5 years, one may invest the maturity amount in FD once RD tenure gets over and restart. Following is the formula to calculate interest on RD. Let's first review the formula to calculate compound interest rate:
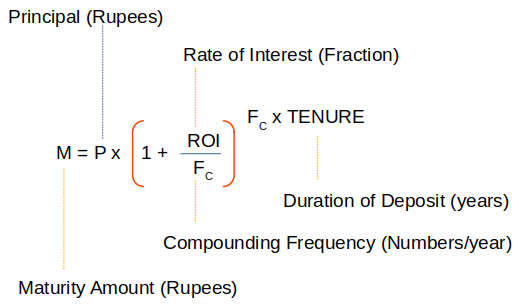
In a recurring deposit scheme, this value estimated from this formula needs to be added for every installment. The ith installment shall have value of TENURE = i/12, where i = 1 to "Duration of Deposit" (years) x 12 (months/year).
| Monthly Installament in INR: | Annual Rate of Interest (in fraction): | ||
| Tenure of the Recurring Deposit (years): | Compounding Frequency (numbers per year): | ||
| Maturity Amount (INR): | Interest (INR): | ||
Why retail investors must not participate in IPO?: Have you heard of Red Herring Prospectus? This is the document released by the company raising money through Initial Public Offering (IPO) and typically consists of more than 400 pages. Ask yourself if you have time and qualification to read this document and conclude anything! Stock market itself is considered by many as a place of gamble and investment through IPO is a bigger gamble with lesser probabilities.
Why maintaining trading account in spouse's name is overhead? Many investors and traders think that running an account in their wives' names who are not earning any income shall help in reducing tax liabilities. That is completely wrong! First, one has to justify the source of income. Just stating some vague sources like gift, private tuition, donations from friends and families... does not meet the criteria. One can escape taxmen's net due to lack of resources in the income tax department and not because all these actions are compliant to tax rules. Gift received is tax free but it is meant for consumption and not investment. Any income generated from gifted capital is taxed into the hands of gift donor (and this is logical too). If someone wants to use a trading account and capital invested in stocks and mutual fund as inheritance, adding that person as nominee is the best method.
Typical Brokerage Structure
While one should not focus on the brokerage rate, one should be aware of the overheads associated with trades. In addition to the brokerage, there are many other types of charges that you need to pay with every trade such as Purchase / Sale Securities Transaction Tax (STT) which is 0.752% in 2024 on NSE, General Sales Taxes CGST and SGST (or IGST: Integrated GST; UTT: Union Territory Tax) each at 9% of brokerage value, NSE transaction charge at 2.11%, SEBI Turnover Fee: 0.06%, Stamp Duty at 10.0% and IPFT charge at 0.06%.
Thus, if your brokerage rate is 0.20% then effective overhead including brokerage would be 0.20 x [1 + 0.09 + 0.09 + 0.752 + 0.0211 + 0.0006 + 0.10 + 0.0006] = 0.4108% which should be kept in mind while making trades for small gains. Thus, a 0.83% profitable change in your delivery-based position is only the break-even level.
| CASH | |||||||
| TRADING | DELIVERY | ||||||
| 1st leg | 2nd leg | Normal | Odd Lot | ||||
| % | Min (paisa)* | % | Min (paisa) | % | Min (paisa) | % | Min (paisa) |
| 0.0150 | 5.00 | 0.0150 | 5.00 | 0.1500 | 5.00 | 0.1500 | 5.00 |
| Minimum Brokerage** per security type: Rs 15.50 | |||||||
* This shall put constraints in case you want to make trades on penny stocks (priced ≤ INR 20). ** This is something which is not explicitly specified by stock brokers.
| Futures and Options | |||||||
| FUTURES | OPTIONS | ||||||
| First day | 1st leg | 2nd leg | Any Other | First day | 1st leg | 2nd leg | Any Other |
| (Non sqoff) | (intraday) | (intraday) | (Day) | (Non sqoff) | (intraday) | (intraday) | (Day) |
| 0.0200 | 0.0200 | 0.0200 | 0.0200 | 0.02% | 0.02% | 0.02% | 0.0001% |
| Minimum Brokerage* per Lot Rs. 50.00 | |||||||
| * Subject to restrictions of SEBI/Exchange guidelines. | |||||||
| COMMODITY | |||||||
| FUTURES | OPTIONS | ||||||
| First day | 1st leg | 2nd leg | Any Other | First day | 1st leg | 2nd leg | Any Other |
| (Non sqoff) | (intraday) | (intraday) | (Day) | (Non sqoff) | (intraday) | (intraday) | (Day) |
| 0.1000 | 0.1000 | 0.0000 | 0.1000 | 0.1% | 0.1% | 0% | 1% |
| Minimum Brokerage per Lot Rs. 0.00 | |||||||
| CURRENCY | |||||||
| FUTURES | OPTIONS | ||||||
| First day | 1st leg | 2nd leg | Any Other | First day | 1st leg | 2nd leg | Any Other |
| (Non sqoff) | (intraday) | (intraday) | (Day) | (Non sqoff) | (intraday) | (intraday) | (Day) |
| 0.1000 | 0.1000 | 0.0000 | 0.1000 | 0.1% | 0.1% | 0% | 2.5% |
| Minimum Brokerage per Lot Rs. 0.00 | |||||||
Some books available in PDF format and seemingly out of copyright: [1]COMMON SENSE STOCK SPECULATION: A treatise on stock speculation and investment, including the experiences of successful traders - by MAURICE COWEN [2]THIS IS THE ROAD TO STOCK MARKET SUCCESS by SEAMANS-BLAKE [3]Tidal Swings of the Stock Market by Scribner Browne [4]The Stock Market Barometer by William Peter Hamilton. [5]Profitable Stock Exchange Investments by Henry Voorce Brandenburg & Co.
Criteria to Select Stocks for FNO Trades in NSE
SEBI defines, monitors and refines the criteria. As per last update in 2018 and valid in 2022, following criteria apply to enter or remain into Future and Option trading category.
- Top 500 stocks: based on average daily market capitalisation and the average daily traded value computed on the 16th of each month, on a rolling basis
- Average daily market capitalization - part of calculation to appear among top 500 stocks
- Average daily traded value - part of calculation to appear among top 500 stocks
- The market wide position limit [20% of the free float market capitalisation of a stock and if stock is already in FNO trade it includes positions in futures and options ] in the security ≥ Rs. 500 crores on a rolling basis
- Median quarter sigma (σ/4) order size values ≥ INR 25 lakh where standard deviation (σ) is Exponentially Weighted Moving Average (EWMA)
- The average daily deliverable value ≥ Rs. 10 crores in the previous six months on a rolling basis
If an existing security fails to meet aforesaid continued eligibility criteria for 3 consecutive months, then no fresh month contract shall be issued on that security. However, the existing contracts may be permitted to trade till expiry and new strikes may be introduced in the existing contract months.
Books on Technical Analysis and Candlestick Charting
These are economical editions for Indian sub-continent in the price range INR 450~700/-- How to Make Money Trading Derivatives by Ashwini Gujral
- Technical Analysis of Stock Trends - by Robert D. Edwards and John Magee
- Candlestick Charting Explained - by Morris and Litchfield
- Martin Pring on Market Momentum - by Martin Pring
Stock Market Propaganda
- FII and DII make the market move high or low - FII और DII मेकट को उच्च या निम्न स्तर पर ले जाते हैं
- Mostly option sellers make money - ज्यादातर विकल्प विक्रेता पैसा कमाते हैं
- Long term investment is guaranteed to be profitable - दीर्घकालिक निवेश लाभदायक होने की गारंटी है
- A share having Price-Earning (PE) ratio > 50 is still a value buying
- The stock market advisers do not give full picture - they do not easily share timeline for their predictions and most of the levels are based on 1:1 reward-risk ratio.
Explanation to number 3. Refer the report prepared by NSE (www1.nseindia.com/ content/ indices/ind_nifty50.pdf). Although the method followed to arrived at the numbers are not described, let's take these number on the face value. Some questions are not answered about what and how much return was generated by companies who were once part of NSE and went bust (Yesbank, Suzlon, JP Associates, Reliance Communications, Idea Cellular...) and how was it accounted for? How does the return account for the debt the companies have on their books? यद्यपि गणना करने के लिए प्रयुक्त विधि का वर्णन नहीं किया गया है, आइए इन संख्याओं को जैसा कि सूचित किया गया मूल्य पर लें। कुछ प्रश्नों के उत्तर नहीं हैं जैसे कि जो कंपनियां कभी एनएसई का हिस्सा थीं और बंद हो गईं (यसबैंक, सुजलॉन, जेपी एसोसिएट्स, रिलायंस कम्युनिकेशंस, आइडिया सेल्युलर ...) ने क्या और कितना प्रतिफल दिया और इसका आकलन कैसे लगाया गया? कंपनियों के बही-खातों में उनके कर्ज को कैसे लेखाबद्ध किया गया है?

However, the fact remains valid that over very long time interval, the rate of return reduces as compared to the selective and partially hidden values projected in media over short term (3 ~ 5 years). हालाँकि, यह तथ्य निर्विवाद है कि बहुत लंबे समय के अंतराल पर आय की दर कम अवधि (3 ~ 5 वर्ष) में मीडिया में प्रस्तुत/मुद्रित "चयनात्मक और आंशिक रूप से छिपे हुए" आय की तुलना में कम होती है।
Question remains: why should one invest in a stock as P/E ratio of 20 when fixed deposits at 5% gives same assured return? The answer lies in the ratio: while in fixed deposits, both numerator and denominator remain fixed, in case of stocks, the denominator (profit or earning) changes and price adjusts accordingly. Let's consider a company which is generating Rupees 100/- as profit and hence as per P/E ratio 20, it should trade at Rupees 2000/- After 5 years, if the profit generated by the company increases to Rupees 150/- the stock price may trade at Rs. 3000/- leading to increase in value of invested amount by 50%. In case of fixed deposits, the invested capital remains Rs. 2000/- and generated profit after 5 years would be Rs. 500/- only.
A graphical view to demonstrate magic of compounding is shown in the chart below. Notice the impact of Rate of Return (ROR) on the wealth multiplier. Notice how a moderate 10% return compounded annually multiplies your wealth 10-times over 25 years and a 12.5% return ends up growing your money 18 times over 25 years - one should not look beyond this time-frame as explained with an example below. If you extrapolate the data up to 40 years and rate of return up to 15%, the return starts getting to unrealistic levels. The impact of tax and inflation is not reflected here.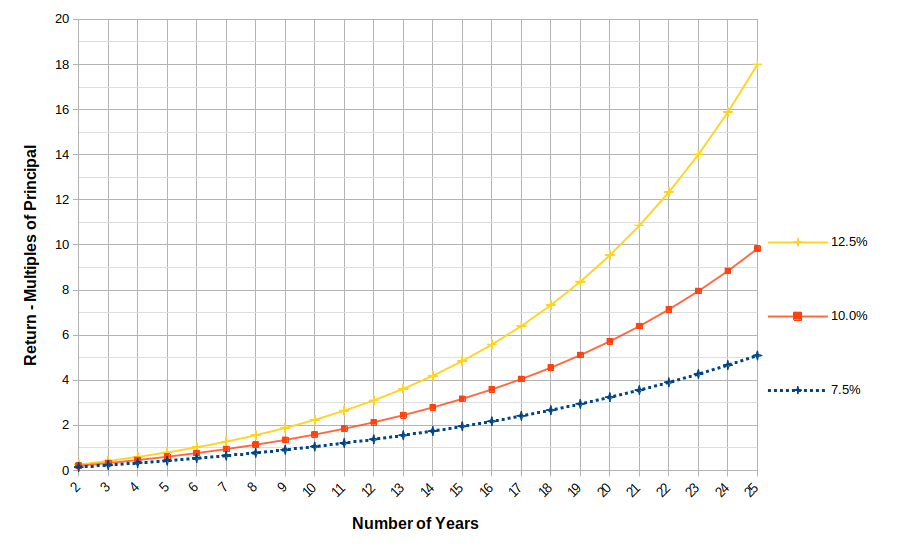
The magic of compounding
| Number of Years | ROR | Return (Number of Times) | ROR | Return (Number of Times) | ROR | Return (Number of Times) | ROR | Return (Number of Times) |
| 2 | 7.5% | 0.16 | 10.0% | 0.21 | 12.5% | 0.27 | 15.0% | 0.32 |
| 3 | 7.5% | 0.24 | 10.0% | 0.33 | 12.5% | 0.42 | 15.0% | 0.52 |
| 4 | 7.5% | 0.34 | 10.0% | 0.46 | 12.5% | 0.60 | 15.0% | 0.75 |
| 5 | 7.5% | 0.44 | 10.0% | 0.61 | 12.5% | 0.80 | 15.0% | 1.01 |
| 6 | 7.5% | 0.54 | 10.0% | 0.77 | 12.5% | 1.03 | 15.0% | 1.31 |
| 7 | 7.5% | 0.66 | 10.0% | 0.95 | 12.5% | 1.28 | 15.0% | 1.66 |
| 8 | 7.5% | 0.78 | 10.0% | 1.14 | 12.5% | 1.57 | 15.0% | 2.06 |
| 9 | 7.5% | 0.92 | 10.0% | 1.36 | 12.5% | 1.89 | 15.0% | 2.52 |
| 10 | 7.5% | 1.06 | 10.0% | 1.59 | 12.5% | 2.25 | 15.0% | 3.05 |
| 11 | 7.5% | 1.22 | 10.0% | 1.85 | 12.5% | 2.65 | 15.0% | 3.65 |
| 12 | 7.5% | 1.38 | 10.0% | 2.14 | 12.5% | 3.11 | 15.0% | 4.35 |
| 13 | 7.5% | 1.56 | 10.0% | 2.45 | 12.5% | 3.62 | 15.0% | 5.15 |
| 14 | 7.5% | 1.75 | 10.0% | 2.80 | 12.5% | 4.20 | 15.0% | 6.08 |
| 15 | 7.5% | 1.96 | 10.0% | 3.18 | 12.5% | 4.85 | 15.0% | 7.14 |
| 16 | 7.5% | 2.18 | 10.0% | 3.59 | 12.5% | 5.58 | 15.0% | 8.36 |
| 17 | 7.5% | 2.42 | 10.0% | 4.05 | 12.5% | 6.41 | 15.0% | 9.76 |
| 18 | 7.5% | 2.68 | 10.0% | 4.56 | 12.5% | 7.33 | 15.0% | 11.4 |
| 19 | 7.5% | 2.95 | 10.0% | 5.12 | 12.5% | 8.37 | 15.0% | 13.2 |
| 20 | 7.5% | 3.25 | 10.0% | 5.73 | 12.5% | 9.55 | 15.0% | 15.4 |
| 21 | 7.5% | 3.57 | 10.0% | 6.40 | 12.5% | 10.9 | 15.0% | 17.8 |
| 22 | 7.5% | 3.91 | 10.0% | 7.14 | 12.5% | 12.3 | 15.0% | 20.6 |
| 23 | 7.5% | 4.28 | 10.0% | 7.95 | 12.5% | 14.0 | 15.0% | 23.9 |
| 24 | 7.5% | 4.67 | 10.0% | 8.85 | 12.5% | 15.9 | 15.0% | 27.6 |
| 25 | 7.5% | 5.10 | 10.0% | 9.83 | 12.5% | 18.0 | 15.0% | 31.9 |
| 26 | 7.5% | 5.56 | 10.0% | 10.9 | 12.5% | 20.4 | 15.0% | 36.9 |
| 27 | 7.5% | 6.05 | 10.0% | 12.1 | 12.5% | 23.1 | 15.0% | 42.5 |
| 28 | 7.5% | 6.58 | 10.0% | 13.4 | 12.5% | 26.1 | 15.0% | 49.1 |
| 29 | 7.5% | 7.14 | 10.0% | 14.9 | 12.5% | 29.4 | 15.0% | 56.6 |
| 30 | 7.5% | 7.75 | 10.0% | 16.4 | 12.5% | 33.2 | 15.0% | 65.2 |
| 31 | 7.5% | 8.41 | 10.0% | 18.2 | 12.5% | 37.5 | 15.0% | 75.1 |
| 32 | 7.5% | 9.12 | 10.0% | 20.1 | 12.5% | 42.3 | 15.0% | 86.6 |
| 33 | 7.5% | 9.88 | 10.0% | 22.2 | 12.5% | 47.8 | 15.0% | 99.7 |
| 34 | 7.5% | 10.7 | 10.0% | 24.5 | 12.5% | 53.9 | 15.0% | 115 |
| 35 | 7.5% | 11.6 | 10.0% | 27.1 | 12.5% | 60.7 | 15.0% | 132 |
| 36 | 7.5% | 12.5 | 10.0% | 29.9 | 12.5% | 68.4 | 15.0% | 152 |
| 37 | 7.5% | 13.5 | 10.0% | 33.0 | 12.5% | 77.1 | 15.0% | 175 |
| 38 | 7.5% | 14.6 | 10.0% | 36.4 | 12.5% | 86.9 | 15.0% | 202 |
| 39 | 7.5% | 15.8 | 10.0% | 40.1 | 12.5% | 97.8 | 15.0% | 232 |
| 40 | 7.5% | 17.0 | 10.0% | 44.3 | 12.5% | 110 | 15.0% | 267 |
Note how the value gets multiplied when rate of return is 15%
No industry or a company can continue growing at fast pace for duration more than 25 years - this is not due to any issue with that particular company but time available for competition to get a foothold is enough to keep the growth of all participants in check.Interest Rate Return Table
Following table gives an idea on interest rate and time required for money to double (100% return) and triple (200% return). The information can be used to benchmark the return from an stock market.
| Rate of Interest | Time (in Years) to DOUBLE when compounded | Time (in Years) to TRIPLE when compounded | ||||
| Annual | Monthly | Quarterly | Annually | Monthly | Quarterly | Annually |
| 4% | 17.36 | 17.42 | 17.67 | 27.51 | 27.60 | 28.01 |
| 5% | 13.89 | 13.95 | 14.21 | 22.02 | 22.11 | 22.52 |
| 6% | 11.58 | 11.64 | 11.90 | 18.36 | 18.45 | 18.85 |
| 7% | 9.931 | 9.988 | 10.24 | 15.74 | 15.83 | 16.24 |
| 8% | 8.693 | 8.751 | 9.006 | 13.78 | 13.87 | 14.27 |
| 9% | 7.730 | 7.788 | 8.043 | 12.25 | 12.34 | 12.75 |
| 10% | 6.960 | 7.018 | 7.273 | 11.03 | 11.12 | 11.53 |
| 11% | 6.330 | 6.388 | 6.642 | 10.03 | 10.12 | 10.53 |
| 12% | 5.805 | 5.862 | 6.116 | 9.201 | 9.292 | 9.694 |
| 13% | 5.361 | 5.418 | 5.671 | 8.497 | 8.587 | 8.989 |
| 14% | 4.980 | 5.037 | 5.290 | 7.893 | 7.984 | 8.385 |
| 15% | 4.650 | 4.707 | 4.959 | 7.370 | 7.461 | 7.861 |
| 16% | 4.361 | 4.418 | 4.670 | 6.912 | 7.003 | 7.402 |
| 17% | 4.106 | 4.163 | 4.415 | 6.508 | 6.599 | 6.997 |
| 18% | 3.880 | 3.937 | 4.188 | 6.149 | 6.240 | 6.638 |
| 19% | 3.677 | 3.734 | 3.985 | 5.828 | 5.918 | 6.316 |
| 20% | 3.495 | 3.552 | 3.802 | 5.539 | 5.629 | 6.026 |
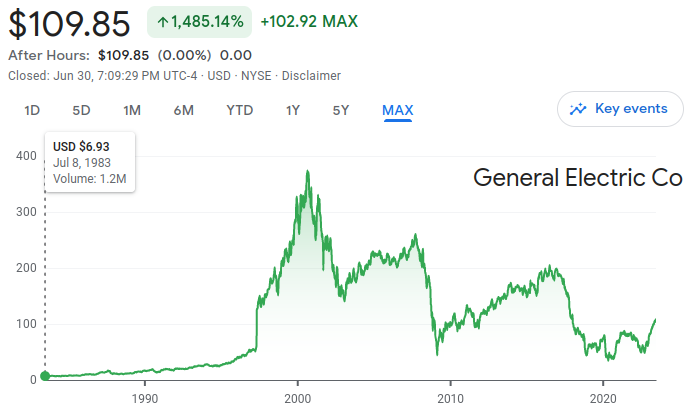
Following example of General Electric shall tell you the story: GE being a pioneer and well-diversified conglomerate has given around 15 fold return over a period of 40 years.
Virtual Money in Stock Market Valuations: the stock price is not a linear function of number of stock being bought or sold.
Full-market capitalization: includes both active (available for day-to-day trading) and inactive shares (such as locked-in shares, those held by insiders, promoters, and governments).
Propaganda of Value Erosion
The market cap and valuations of stock holdings (ownership) at market price is used to judge net worth of an individual and organization. This is demonstrated to be a wrong number from the data below. The stock price is not a linear function of trading activity and stock holding. A change of just 5% ownership can bring the valuation down by 25%. If the promoters of a company wants to sell all his stakes in open market (without bulk deals and acquisitions), how much value shall they get as compared to current market price?
In the news, one very frequently come across statements such as "investors lost 5 Lakh Crore of value in recent sell off". This is pure propaganda and does not convey the true data. Real valuation is the ownership in the operations and assets of the company and one loses or gains valuation based on operational parameters of the company and not daily increase or decrease of market cap. Note, there is always a buyer for a seller and vice versa. Someone's loss is someone's gain.
Free-float Market Cap: method excludes locked-in shares, such as those held by insiders, promoters, and government and is based on shares readily available in the market.
Some data as on 21-Apr-2023 of NSE stocks:
| Name | Shares Total | Shares Free-Float | % Free-Float | Trade Volume | Trade % of Free Float | % Price Change |
| TCS | 3,65,90,51,373 | 1,02,51,34,381 | 28% | 19,29,184 | 0.188% | + 1.75% |
| LT | 1,40,54,82,190 | 1,20,88,39,078 | 86% | 10,09,316 | 0.083% | - 0.80% |
| HDFCBANK | 5,57,97,42,786 | 4,41,48,51,341 | 79% | 1,00,64,309 | 0.228% | + 0.10% |
| ADANIENT | 1,14,00,01,121 | 27,37,52,100 | 24% | 20,90,833 | 0.764% | - 2.22% |
Can you draw an inference from this information?
Area of research - Stock Markets
Some useful objective of web scraping can be: find stock option with high premium to CMP ratio, lowest "LOT SIZE x CMP" value - this decides the margin money required, strike price(s) with highest open interest for a list of scrips, monitor shareholding pattern and identify stock where the % holding by retail investors increased sharply in short duration...
Sample code to scrap NSE website in 2025
import os
import json
import requests
url_cm = "https://nsearchives.nseindia.com/content/cm/"
csv_file = "BhavCopy_NSE_CM_0_0_0_20250616_F_0000.csv.zip"

headers = {
  'User-Agent': 'Mozilla/5.0 (Windows NT 10.0; Win64; x64) Chrome/91.0.4472.124'
}
try:
  print(f'Downloading {csv_file} from NSE')
  url = url_cm + csv_file
  response = requests.get(url, headers=headers, stream=True)
  response.raise_for_status()

  file_name = url.split("/")[-1]
  save_path = os.path.join(".", file_name)
  with open(file_name, 'wb') as f:
    f.write(response.content)

except Exception as e:
  print(f'Could not download {csv_file} from NSE')
To extract (scrape) the NSE website, refer the Python code available here. This works with new NSE website in 2025. This is a 'monolithic' version of Python code available at github.com/RuchiTanmay/nselib. The description as per package: "Python Library to get publicly available data on new NSE india website."
This requires an intermediate level of experience in Python to utilize this package efficiently. There is an example to manipulate the scraped data at the end of the code which is copied below:output = get_price_volume_data("RELIANCE", "16-06-2025", "17-06-2025")
for col_name, value in zip(output.columns.to_numpy(), output.loc[1].to_numpy()):
print(col_name.ljust(25, " "), value.ljust(25, " "))
- Historical data of stocks listed on National Stock Exchange (NSE)
- Python script (applicable to older website of NSE prior to 2021) to retrieve the closing price of stocks listed in a file named stocksList.txt. The code does not check internet connectivity and correctness of the symbol.
All the codes listed here are outdated as on 2023 as NSE allows access to website www.nseindia.com only through their REST API. NSEPython (pip install nsepython) is a Python library to get data from nseindia.com and niftyindices.com sites by communicating with their REST APIs. The source code is available at github.com/aeron7/nsepython and documentation is available at unofficed.com/nse-python/documentation. As per the code owner of NSEPython, "All the functions of the two famous packages NsepY and NSETools are also migrated here with same function name." The Python module (i.e. code library) contains 59 functions (included in a single file), though not all are to scrape the data. Few common utilities are: nse_quote_ltp, nse_optionchain_ltp, nse_blockdeal...
The functions in the library could be arranged into two categories: one used for scraping and other for internal use by other functions. payload is the most important variable in the library which prepares required URL to retrieve information from NSE website. There are many functions to generate 'payload' such as nse_quote(symbol) where symbol is the name of the scrip. The name of scrip (as per version available in April-2023 has to be in uppercase: for example nse_quote_ltp(RELIANCE) shall work but nse_quote_ltp(reliance) shall not work. Adding symbol = symbol.upper() in function nse_quote(symbol) works for both upper and lower case names of the scrips.
You can use this file: nseScraper.py in the same folder where your local code exists, in case you do not want to use "pip install nsepython". Following lines of code can be use to get Last Traded Price (LTP), however it does not work for scrips such as M&M or L&TFH.
from nseScraper import *
scrip = "tcs"

#This works
print("LTP of " + scrip + " is " + str(nse_quote_ltp(scrip)) + "\n")
#This works
print("Option: " + str(nse_quote_ltp(scrip, "latest", "PE", 3000)))
Read .csv file and statistical calculations in Python
#On WIN10, python version 3.5
#C:\Users\XYZ\AppData\Roaming\Microsoft\Windows\Start Menu\Programs\Python 3.5
#To check that the launcher is available, execute in Command Prompt: py
#To install numPy: C:\WINDOWS\system32>py.exe -m pip install numpy
#To install sciPy: C:\WINDOWS\system32>py.exe -m pip install scipy
#To install pandas: C:\WINDOWS\system32>py.exe -m pip install pandas
#To install matplotlib: C:\WINDOWS\system32>py.exe -m pip install matplotlib
#To get list of installed packages: C:\WINDOWS\system32>py.exe -m pip freeze

import numpy as npy    # Remember: NumPy is zero-indexed
from pandas import Series, DataFrame
import scipy
from scipy import stats
import matplotlib.pyplot as plt

# ----------Read data from TXT/CSV/XLSX formats-------------------------------
# Get data from a SIMPLE txt fie. loadtxt does not work with mixed data type
# rawData = npy.loadtxt('statsData.txt', delimiter=' ', skiprows=1, dtype=str)
dataRaw = npy.loadtxt('statsCSV.txt', delimiter=',', skiprows=1)

# Useful for COLUMNS with STRINGS and missing data
#rawData = npy.genfromtxt("statsData.txt", dtype=None, delimiter=" ", skip_header=1, names=True)

# Get data from a CSV file
#dataRaw = pnd.read_csv('statsData.csv', sep=',', header=0)
#dataRaw = pnd.read_excel('statsData.xlsx', sheetname='inputDat')

npy.set_printoptions(precision=3)    #Precision for floats, suppresses end zeros
npy.set_printoptions(suppress=True)  #No scientific notation for small numbers

#Alternatively use formatter option, it will not suppress end ZEROS
npy.set_printoptions(formatter={'float': '{: 8.2f}'.format})

mean = npy.mean(dataRaw, axis = 0)  # axis keyword: 0 -> columns, 1 -> rows
print("Mean:     ", mean)
medn = npy.median(dataRaw, axis = 0)
print("Median:   ", medn)
sdev = npy.std(dataRaw, axis = 0)
print("SD:       ", sdev)

# Generate plot
n = dataRaw[:,1].size               #Python arrays are 0-based
x = npy.arange(1, n+1)
y = dataRaw[:, 1]                   #Read first column of the input data
plt.title("Crude Price")
plt.xlabel("Day")
plt.ylabel("Crude Price in US$")
plt.plot(x,y)
plt.show()
The file statsCSV.txt can be found here.
The data has been scraped through NSE website using a Python code. This code requires list of NIFTY stocks stored in a text file, sample can be found here.
The Python code used to generate a plot using matplotlib utility is here.
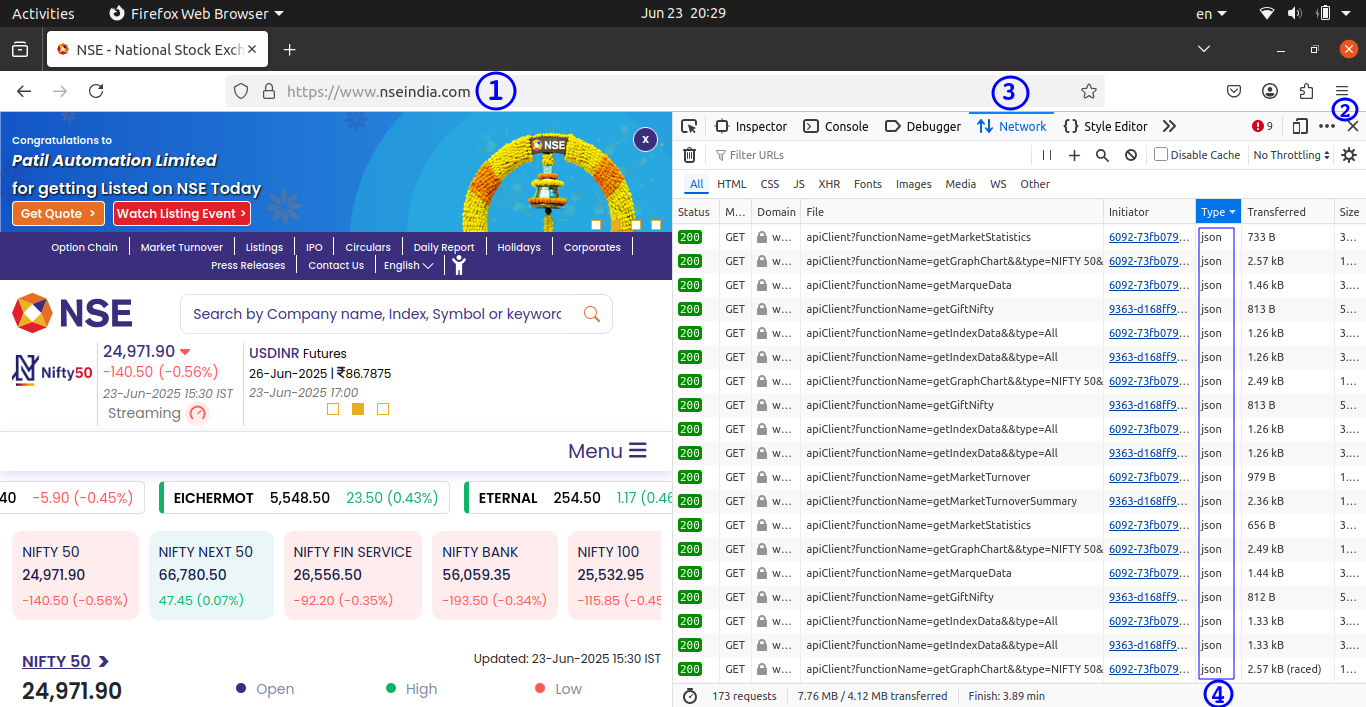
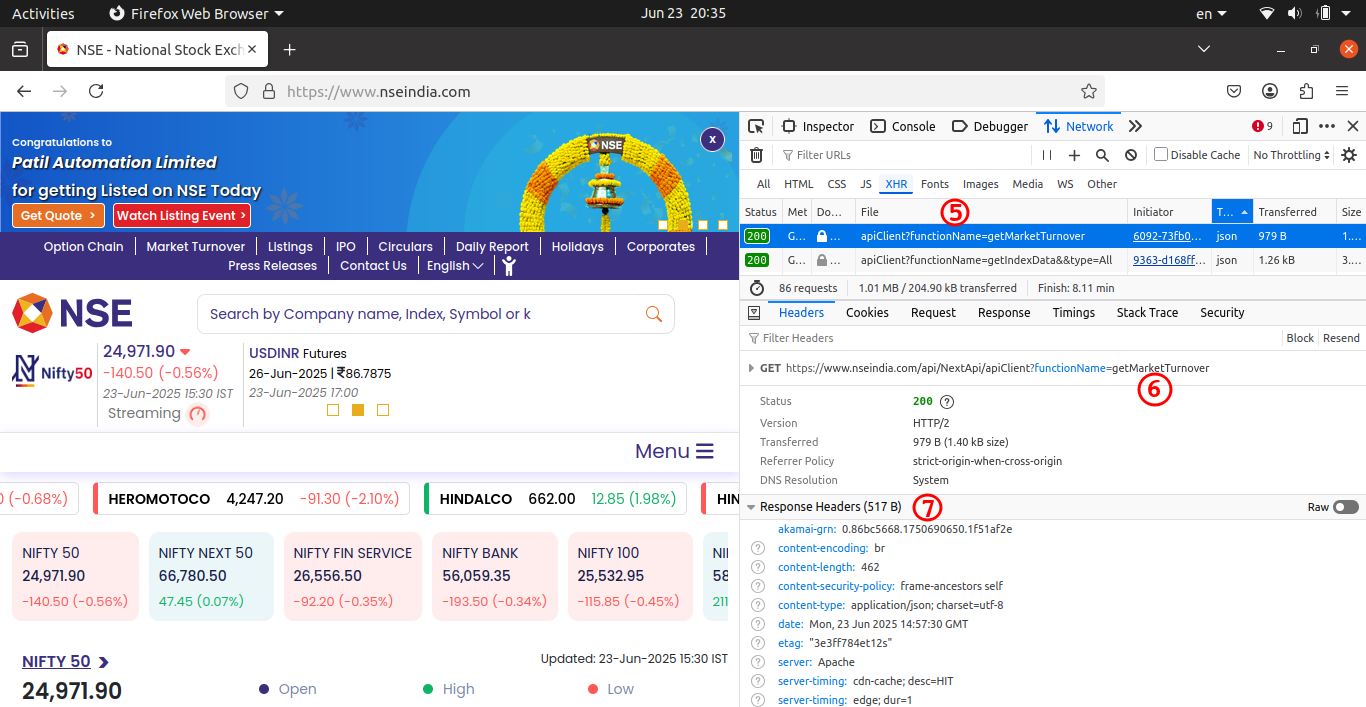
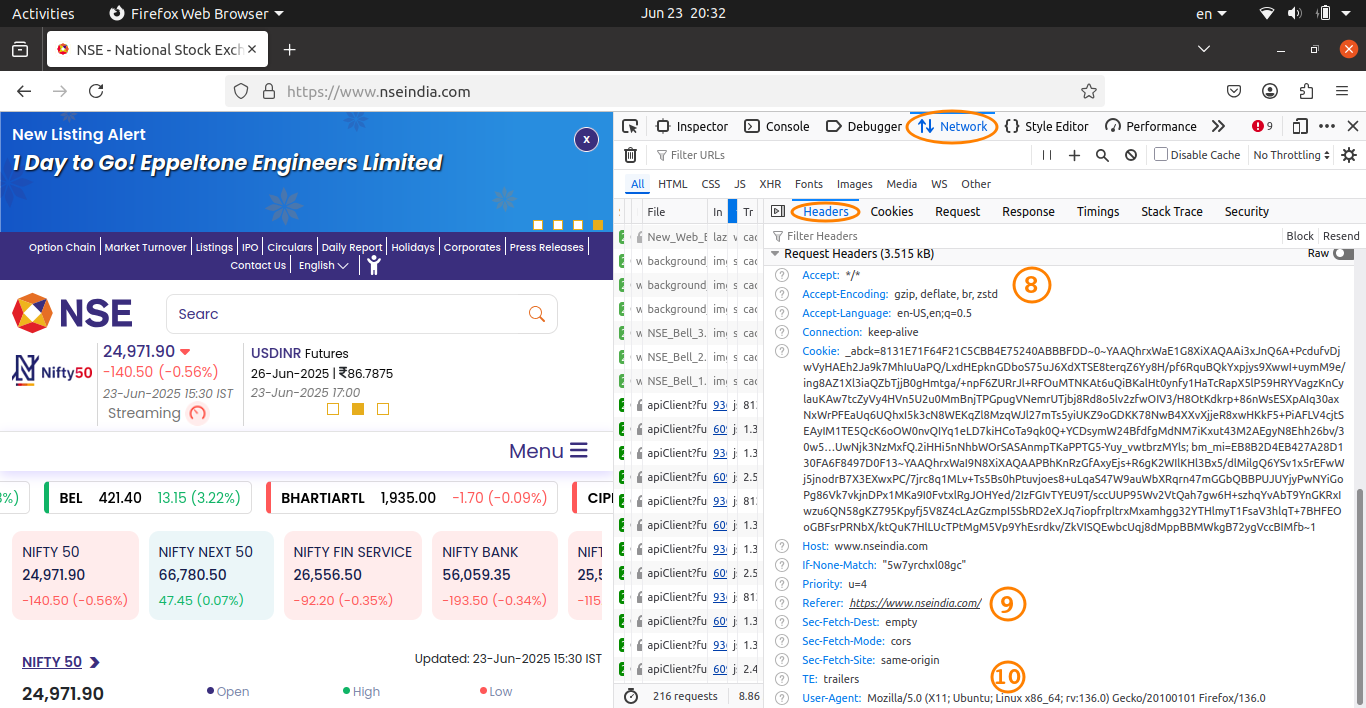
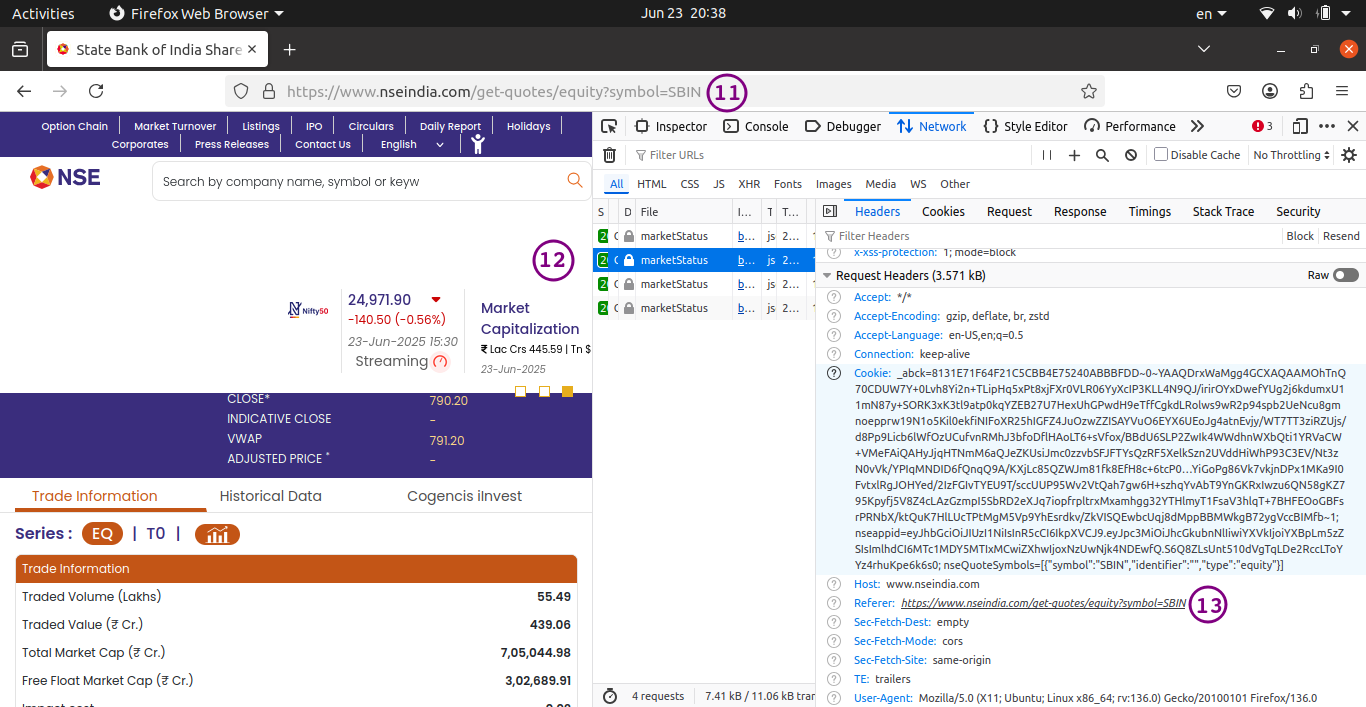
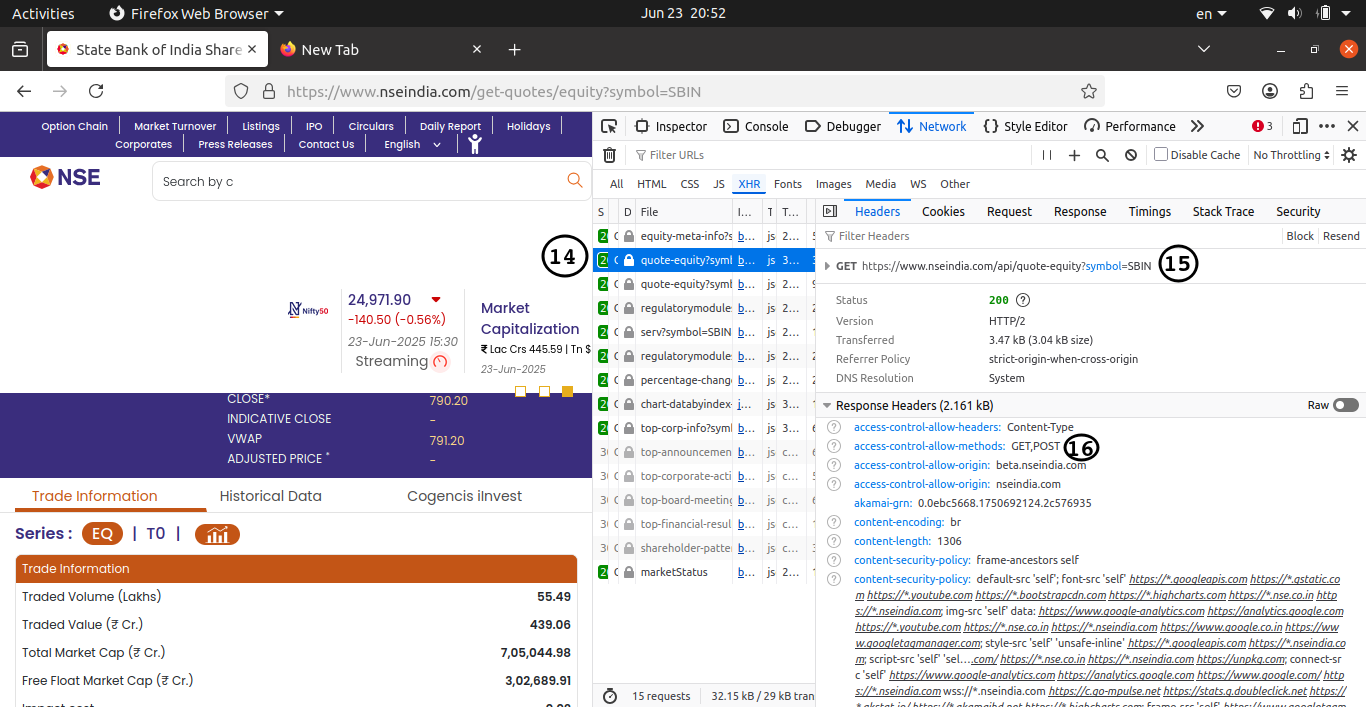
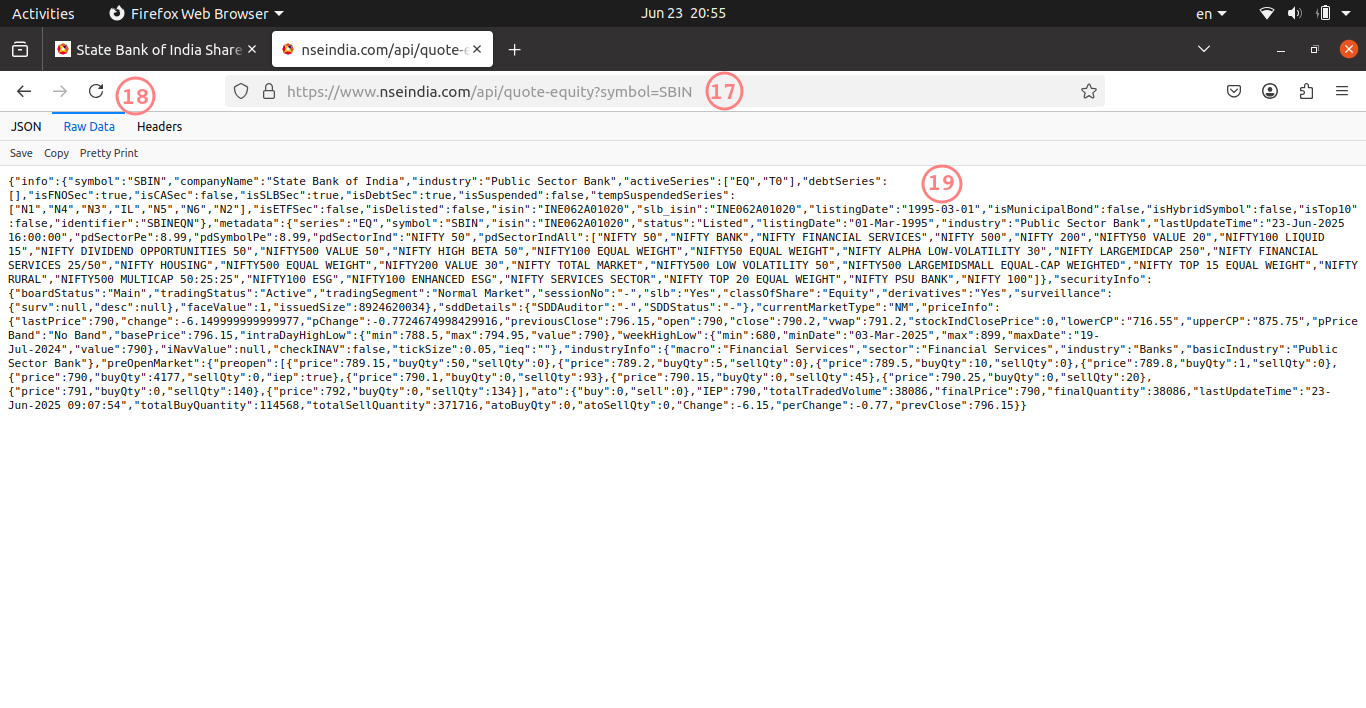
To extract (scrape) the NSE website, refer the Python code available here. A step-by-step approach to get the link to scrape the data in JSON format is shown below. In FireFox, one need to follow Setting > More Tools > Web Developer Tools or use Ctrl+Shift+I to get the the window shown here. Hover mouse on image to pause to slide transition.
import requests
import json
'''
Python code to scrape NSE Option-Chain. Tested in Ubuntu 20.04 LTS in
and the data was printed correctly first time and then 401 error.
'''
baseurl = "https://www.nseindia.com/"
url = f"https://www.nseindia.com/api/option-chain-indices?symbol=NIFTY"
headers = {'User-Agent': 'Mozilla/5.0 (Windows NT 10.0; Win64; x64) AppleWebKit/537.36 (KHTML, '
                         'like Gecko) '
                         'Chrome/80.0.3987.149 Safari/537.36',
           'accept-language': 'en,gu;q=0.9,hi;q=0.8', 'accept-encoding': 'gzip, deflate, br'}
session = requests.Session()
request = session.get(baseurl, headers=headers, timeout=10)
cookies = dict(request.cookies)
response = session.get(url, headers=headers, timeout=10, cookies=cookies)
print(response.status_code)
if response.status_code != 200:
  print("Response from server not successful, exiting!\n")
  exit()
else:
print(response)There are other codes written in Python such as fabtrader.in/a-python-utility-to-fetch-live-data-from-nse-india-website and fabtrader.in/download-intraday-and-eod-historical-data-for-nse-stocks-indices-futures-options-using-python which work as intended.
import requests
import json
default_header = {
"User-Agent": "Mozilla/5.0 (X11; Ubuntu; Linux x86_64; rv:136.0) Gecko/20100101 Firefox/136.0"
}
headers = {
"referer": "https://www.nseindia.com",
"Accept": "text/html,application/xhtml+xml,application/xml;q=0.9,*/*;q=0.8",
"Accept-Encoding": "gzip, deflate",
"Accept-Language": "en-US,en;q=0.9,hi;q=0.8",
"Connection": "keep-alive",
"Upgrade-Insecure-Requests": "1",
"User-Agent": 'Mozilla/5.0 (X11; Ubuntu; Linux x86_64; Windows NT 10.0; Win64; x64) '
'FireFox/136.0 AppleWebKit/537.36 (KHTML, like Gecko) '
'Gecko/20100101 Chrome/138.0.7204.49'
}
URL1 = "https://www.nseindia.com/get-quotes/equity?symbol=SBIN"
URL2 = "https://www.nseindia.com/api/quote-equity?symbol=SBIN§ion=trade_info"
req_session = requests.Session() # Create a persistent session
nse_live = req_session.get(URL1, headers=default_header, timeout=20)
cookies = dict(nse_live.cookies)
response = req_session.get(URL2, headers=headers, cookies=cookies)
if (response.status_code == 200):
htmlText = response.json()
print("M-Cap: ", htmlText['marketDeptOrderBook']['tradeInfo']['totalMarketCap'])
print(htmlText)The above code extracted trade information as JSON data such as Total Market Cap, Free-Float Market cap as JSON data. The trick here is to find out the link or URL which server uses to return the data (nseindia.com/api/quote-equity?symbol=SBIN§ion=trade_info"). Note how the values for a particular key are accessed in nested JSON dictionary.
nse_scips = ['HDFCBANK', 'RELIANCE', 'ICICIBANK', 'BHARTIARTL', 'ITC', 'INFY', 'LT', 'TCS', 'AXISBANK', 'KOTAKBANK', 'SBIN', 'M&M', 'BAJAJFINANCE', 'ETERNAL', 'HINDUNILVR', 'SUNPHARMA', 'HCLTECH', 'MARUTI', 'NTPC', 'TITAN', 'BEL', 'ULTRATECH', 'TMPV', 'JSWSTEEL', 'TRENT', 'TATASTEEL', 'POWERGRID', 'ONGC', BAJANFINSV', 'ASIANPAINTS', 'GRASIM', 'JIOFIN', 'TECHM', 'ADANIPORTS', 'BAJAJ-AUTO', 'HINDALCO', 'SHRIRAMFIN', 'COALINDIA', 'NESTLEIND', 'CIPLA', 'HDFCLIFE', 'SBILIFE', 'EICHERMOT', 'ADANIENT', 'DRREDDY', 'APOLLOHOSP', 'WIPRO', 'TATACONSUM', 'HEROMOTOCO', 'INDUSIND']URL_base = "https://www.nseindia.com/get-quotes/equity?symbol=" URL_info = "https://www.nseindia.com/api/quote-equity?symbol=" for scrip in nse_scrip: URL_base += scrip URL_info += scrip + "§ion=trade_info"
The code can be improved to update the weight contribution table described below. Market Cap (MCAP) is in INR Crores. Notice how top 20 companies contribute almost 75% of weight in NIFTY50.
| Promoters | Public | Emp. Trust | DR | LTP (INR) | Total | |||
|---|---|---|---|---|---|---|---|---|
| HDFCBANK | 0 | 6,62,37,93,396 | 17,069 | 3,08,266 | 1,986 | 6,62,41,18,731 | 1315485 | 11.58 |
| RELIANCE | 6,64,54,96,096 | 6,61,70,70,374 | 0 | 26,98,06,428 | 1,519 | 13,53,23,72,898 | 1005001 | 8.846 |
| ICICIBANK | 0 | 5,79,71,22,701 | 0 | 1,32,48,05,129 | 1,428 | 7,12,19,27,830 | 827713 | 7.285 |
| BHARTIARTL | 3,19,46,29,531 | 2,89,54,26,773 | 43,36,677 | 0 | 2,033 | 6,09,43,92,981 | 588727 | 5.182 |
| ITC | 0 | 12,51,06,11,054 | 0 | 35,08,727 | 413 | 12,51,41,19,781 | 516626 | 4.547 |
| INFY | 54,20,29,249 | 3,16,17,17,564 | 96,55,927 | 43,98,60,715 | 1,611 | 4,15,32,63,455 | 509195 | 4.482 |
| LT | 0 | 1,16,46,60,245 | 19,48,87,516 | 1,56,44,404 | 3,597 | 1,37,51,92,165 | 418905 | 3.687 |
| TCS | 2,59,65,58,628 | 1,02,15,28,890 | 0 | 0 | 3,423 | 3,61,80,87,518 | 349700 | 3.078 |
| AXISBANK | 24,48,60,645 | 2,74,94,29,651 | 0 | 10,30,78,770 | 1,170 | 3,09,73,69,066 | 321628 | 2.831 |
| KOTAKBANK | 51,46,40,397 | 1,47,35,82,596 | 0 | 0 | 2,169 | 1,98,82,22,993 | 319635 | 2.813 |
| SBIN | 5,07,97,75,288 | 3,76,50,57,276 | 0 | 0 | 813 | 8,84,48,32,564 | 306062 | 2.694 |
| M&M | 22,55,78,998 | 95,29,04,041 | 4,40,22,782 | 2,10,23,010 | 3,165 | 1,24,35,28,831 | 301613 | 2.655 |
| BAJAJFINANCE | 3,40,12,25,450 | 2,81,07,14,060 | 23,47,010 | 0 | 923 | 6,21,42,86,520 | 259429 | 2.283 |
| ETERNAL | 0 | 9,07,28,85,639 | 57,74,65,008 | 0 | 260 | 9,65,03,50,647 | 235668 | 2.074 |
| HINDUNILVR | 1,45,44,12,858 | 89,51,78,404 | 0 | 0 | 2,307 | 2,34,95,91,262 | 206527 | 1.818 |
| SUNPHARMA | 1,30,71,34,535 | 1,09,22,00,435 | 0 | 0 | 1,678 | 2,39,93,34,970 | 183217 | 1.613 |
| HCLTECH | 1,65,03,01,111 | 1,05,86,09,882 | 47,54,103 | 0 | 1,719 | 2,71,36,65,096 | 181933 | 1.601 |
| MARUTI | 18,32,46,476 | 13,11,56,098 | 0 | 0 | 12,622 | 31,44,02,574 | 165545 | 1.457 |
| NTPC | 4,95,53,46,251 | 4,74,13,19,883 | 0 | 0 | 334 | 9,69,66,66,134 | 158242 | 1.393 |
| TITAN | 46,96,01,920 | 41,74,43,340 | 7,40,900 | 0 | 3,708 | 88,77,86,160 | 154788 | 1.362 |
| BEL | 3,73,79,21,934 | 3,57,18,56,895 | 0 | 0 | 427 | 7,30,97,78,829 | 152500 | 1.342 |
| ULTRATECH | 17,45,32,016 | 11,96,14,676 | 5,30,718 | 0 | 12,436 | 29,46,77,410 | 148753 | 1.309 |
| TATAMOTORS | 1,56,73,68,597 | 2,11,39,80,145 | 0 | 0 | 689 | 3,68,13,48,742 | 145558 | 1.281 |
| JSWSTEEL | 1,09,64,89,242 | 1,34,39,90,038 | 49,74,686 | 0 | 1,060 | 2,44,54,53,966 | 142450 | 1.254 |
| TRENT | 13,15,50,881 | 22,39,36,580 | 0 | 0 | 6,223 | 35,54,87,461 | 139345 | 1.226 |
| TATASTEEL | 4,14,35,94,780 | 8,33,99,36,761 | 0 | 0 | 166 | 12,48,35,31,541 | 138343 | 1.218 |
| POWERGRID | 4,77,48,84,280 | 4,52,57,19,539 | 0 | 0 | 295 | 9,30,06,03,819 | 133441 | 1.175 |
| ONGC | 7,40,88,67,093 | 5,17,14,12,113 | 0 | 0 | 241 | 12,58,02,79,206 | 124667 | 1.097 |
| BAJANFINSV | 96,82,49,700 | 62,67,38,895 | 16,73,502 | 0 | 1,980 | 1,59,66,62,097 | 124082 | 1.092 |
| ASIANPAINTS | 50,47,85,198 | 45,39,57,926 | 4,54,666 | 0 | 2,431 | 95,91,97,790 | 110334 | 0.971 |
| GRASIM | 29,34,11,523 | 38,51,03,710 | 20,65,343 | 0 | 2,850 | 68,05,80,576 | 109747 | 0.966 |
| JIOFIN | 2,99,38,87,366 | 3,35,92,54,257 | 0 | 0 | 327 | 6,35,31,41,623 | 109747 | 0.966 |
| TECHM | 34,26,99,332 | 63,62,94,380 | 0 | 0 | 1,677 | 97,89,93,712 | 106713 | 0.939 |
| ADANIPORTS | 1,42,33,76,085 | 73,67,62,860 | 0 | 0 | 1,429 | 2,16,01,38,945 | 105283 | 0.927 |
| BAJAJ-AUTO | 15,37,08,367 | 12,54,30,000 | 1,19,241 | 0 | 8,393 | 27,92,57,608 | 105267 | 0.927 |
| HINDALCO | 77,84,64,497 | 1,45,82,95,041 | 1,04,66,985 | 0 | 698 | 2,24,72,26,523 | 101840 | 0.896 |
| SHRIRAMFIN | 47,75,81,380 | 1,40,28,02,500 | 0 | 0 | 677 | 1,88,03,83,880 | 94956 | 0.836 |
| COALINDIA | 3,89,07,35,938 | 2,27,19,92,389 | 0 | 0 | 387 | 6,16,27,28,327 | 87903 | 0.774 |
| NESTLEIND | 60,51,50,790 | 35,90,06,370 | 0 | 0 | 2,388 | 96,41,57,160 | 85731 | 0.755 |
| CIPLA | 23,52,87,003 | 57,05,89,469 | 17,40,648 | 0 | 1,498 | 80,76,17,120 | 85451 | 0.752 |
| HDFCLIFE | 1,08,33,42,272 | 1,06,91,06,081 | 5,39,834 | 0 | 790 | 2,15,29,88,187 | 84427 | 0.743 |
| SBILIFE | 55,50,00,000 | 44,71,35,083 | 0 | 0 | 1,857 | 1,00,21,35,083 | 83024 | 0.731 |
| EICHERMOT | 13,45,64,944 | 13,95,99,136 | 0 | 0 | 5,723 | 27,41,64,080 | 79886 | 0.703 |
| ADANIENT | 85,37,70,953 | 30,04,09,776 | 0 | 0 | 2,608 | 1,15,41,80,729 | 78347 | 0.690 |
| DRREDDY | 22,23,05,640 | 60,96,97,465 | 24,52,260 | 0 | 1,271 | 83,44,55,365 | 77480 | 0.682 |
| APOLLOHOSP | 4,21,83,041 | 10,16,01,616 | 0 | 0 | 7,573 | 14,37,84,657 | 76938 | 0.677 |
| WIPRO | 7,61,68,40,898 | 2,85,29,53,922 | 1,19,05,480 | 0 | 267 | 10,48,17,00,300 | 76174 | 0.670 |
| TATACONSUM | 33,48,13,832 | 65,46,84,726 | 0 | 0 | 1,096 | 98,94,98,558 | 71740 | 0.631 |
| HEROMOTOCO | 6,94,88,181 | 13,05,22,655 | 0 | 0 | 4,244 | 20,00,10,836 | 55390 | 0.488 |
| INDUSIND | 11,75,16,010 | 62,50,70,496 | 0 | 3,64,67,966 | 858 | 77,90,54,472 | 53609 | 0.472 |

The second interpretation can be a question like this: "To cause 1% or 250 points increase in NIFTY, price of HDFCBANK should increase by what percent?" The answer is 1.0/0.116 = 8.62%
Table to calculate lot size equivalent of a Portfolio: CMP = Current Market Price. The scrip code used here are for demonstration and does not require to be the same as in one's portfolio so long the CMP and quantity are correct. If the portfolio contains more than 10 stocks, the process can be repeated in multiple steps and values added to get total lot size.
| S. No. | Scrip Name | CMP of the Stock, c | Quantity in Portfolio, Q | % Weight to NSE Lot, w | Remark |
| 001 | NIFTY | 100% | Total lot value | ||
| 002 | |||||
| 003 | |||||
| 004 | |||||
| 005 | |||||
| 006 | |||||
| 007 | |||||
| 008 | |||||
| 009 | |||||
| 010 | |||||
| 011 | |||||
| Calculate lot size of the portfolio: | |||||
What is the expected change in portfolio value for 100 points change in NIFTY level? If every stock in this portfolio increase by 1%, what would be the change in NIFTY (assuming no change in other stocks)? ΔN = Σ[1/wi] and Δ(Portfolio) = Σ(Q x ΔC)
Jargon in Stock Market Trading
By design and by attributes, stock markets are 'manipulative' in nature and one should not complain that bigger players control it. Some of the terms which are very frequently used are: Bull Trap, Bear Raid, Momentum, Oversold, Overbought, Support, Resistance, Double-Top, Double-Bottom, Bottom Fishing, Indicators, Pivot Point, Trend Reversal, Consolidation, Accumulation, Distribution... Trend is your friend until there is a bend in the end!

It is always (with some exceptions) desirable to have source(s) of passive income(s) to enable an individual follow the course he wishes to. However, such sources are not easy to put in place or scale up in terms of value. Some of such options with associated constraints are tabulated below. यह हमेशा वांछनीय होता है (कुछ अपवादों के साथ) की निष्क्रिय आय का स्रोत होना हर उस व्यक्ति के लिए आवश्यक है जो अपना जीवन अपनी शर्तों पर जीना चाहता है। हालांकि, ऐसे स्रोतों को मूल्य के संदर्भ में जगह देना या मापना आसान नहीं है। संबंधित बाधाओं के साथ ऐसे कुछ विकल्प नीचे सारणीबद्ध हैं। Note that passive income is not same as self-employment or freelancing.
| S. No. | Description | Competition or Entry Barrier | Required Skills | Required Infrastructure | Expected Return |
| 001 | Invest in share market, bonds | None | Selection of stocks | Demat account and investible cash | 10% annualized on > 10 years basis |
| 002 | Tuition to kids, E-books, create and sell courses | Crowded market | Handling kids and their attention | Teaching material, hand-outs, videos, online streaming tools, E-books can have just 30-50 pages | -?- |
| 003 | Webinar on niche topics | Big tech companies already present | It is difficult to get many topics which make you stand-out | Presentations, hand-outs, videos, online streaming tools | -?- |
| 004 | Make Reviews of Books | Requires solid credentials to get noticed | Experience in writing essays | Time to read and think | Low volume, low income |
| 005 | Write Articles for Webpages (blogging) | Crowded segment | Requires solid credentials to get noticed | Minimal: internet connection and laptop | High volume, low income |
| 006 | Make Product Reviews | Crowded segments | Needs to know multiple products | Minimal: internet connection and laptop, video recording devices | High volume, low income |
ये इक्कीसवीं सदी में सूचना प्रौद्योगिकी और तेजी से बदलती प्रौद्योगिकी के युग के सैकड़ों विकल्पों में से कुछ उदाहरण हैं। इनमें से कई में पूर्णकालिक नौकरी के बराबर बहुत अधिक ऊर्जा और समय की आवश्यकता होती है और इसलिए वे निष्क्रिय स्रोत बिल्कुल नहीं हो सकते हैं। या तो आप पहले ही काम दे दें या अपने पिछले काम को अपने लिए पैसे कमाने दें। कुछ उत्पाद, कुछ पाठ्यक्रम, कुछ इ-बुक निष्क्रिय आय के स्थिर स्रोत नहीं बन सकते हैं। These are some of the examples of hundreds of option available in twenty-first century dominated with information technology and era of fast changing technology. Many of these require lot of energy and time equivalent to full-time job and hence they may not be passive source at all. Either you give work upfront or let your past work earn money for you. Few of anything such few products, few courses, few e-books do not make steady sources of passive income. Based on the options available, the sources of passive income can be categorized into 3 groups: i) Those related to already accumulated capital, ii) those related to skills available and iii) those related to one's professional, personal and social networks.
Unless one inherit large sum of capital, any passive income has to necessarily follow some duration of active income to create a portfolio which is a mix of liquid investments. Just set aside 20 - 25% of your active income for 10 years and see the magic.
Any source of passive income should account for inflation, depreciation, taxes and maintenance costs. Fixed deposits, at low interest rate periods, are not a passive source of income if you account for 20% tax on interest and inflation. Investment in physical gold may always be at least inflation beating income as it is still the standard to benchmark various assets.
The Public Provident Fund fetches 7.1% return in 2023 and this is exempt from income tax irrespective of the tax rate and income value. This is equivalent to approx. 10% of income subject to tax. However, the constraint is limit of INR 1,50,000 per year per person. The return from dividends from listed companies in India is approx 1.0% of current market price (unless you have invested 20~30 years ago). The rental income of a house having market value of INR 1.0 Crore is in the range of 4.8 lakh per year. This income is taxable in normal tax bracket. Thus, the yield turns out to be approx. 3.0%. As can be seen from these examples, the returns from many passive sources of investment are nominal and sometimes fall below the inflation limit. However, the brighter side of such investments lies in the large accumulation over a period of time resulting in high value of portfolio. Note that the interest payment to an EPF account stops 3 years after the last contribution by employer.
Gratuity: it is a part of once CTC (cost-to-company) and may not reflect in Form-16. Gratuity is payable only after continuous service of 5 years. Gratuity Amount = Gratuity Salary (S) x Qualifying period (Y) x 15/26. For service period > 5 years, service > 6 months is considered into Qualifying period. Thus, exit from a company after 6 years 5 months shall have gratuity payable for 6 years only. In case of exit after 6 years 7 months, gratuity would be payable for 7 years.
For more details, refer to https://clc.gov.in/clc/sites/default/files/PaymentofGratuityAct.pdf and as per https://labour.gov.in/sites/default/files/press_release-6_03_2019_final.pdf - "gratuity amount ceiling has been increased from Rs.10 Lakhs to 20 Lakhs w.e.f. 29.3.2018" and it further describes "Ministry of Finance has enhanced the income tax exemption for gratuity under section 10 (10) (iii) of the Income Tax Act, 1961 to Rs. 20 lakhs. This would benefit those employees of PSUs and other employees not covered by Payment of Gratuity Act, 1972."As per article, bajajfinserv.in/investments/income-tax-exemption-on-gratuity - for private sector employees covered under Payment of Gratuity Act of 1972: gratuity is partially tax-free under Section 10 (10). As per FAQ section "Is gratuity taxable if I resign?" it seems gratuity amount is not taxable up to exemption limit of INR 20 lakh.
Find your niche to create a source of side and/or passive income: write automation scripts for numerical simulations such Siemens STAR-CCM+ and ANSYS FLUENT, tutor pre-college students in maths and physics, develop business templates, review mechanical test and simulation reports, write short stories and essays for school kids, develop test module for engineering and aptitude tests, conduct training sessions for working professionals on office tools...
Make Estimate of Passive Income before Tax
| Description | Monthly | Quarterly | Half-yearly | Yearly |
| Rent income deducting maintenance | - | - | - | |
| Stocks Dividend | - | - | ||
| PPF | - | - | - | |
| Savings Account Interest | - | - | ||
| EPF: Employee Provident Fund | - | - | - | |
| Active Sources of Income | ||||
| Stocks: Swing Trading | - | - | ||
| Stocks: Speculative Income | - | - | ||
| Other sources | - | - | ||
| Click on 'Calculate' button to estimate annual income | ||||
You can compare your sources of income with total annual expenses calculated here.
If a source of passive income is generated from an investment made from loan, total repayment over the duration of loan should also account for net repayment. The example calculator shown below can be used. The assumption is fixed rate of interest of the entire repayment duration and no partial pre-payment. EMI = P * r * (1+r)^n / ((1+r)^n - 1) = P * r / (1 - 1/(1+r)^n)
| Principal amount in INR Lakh: | Rate of Interest per annum (in %): | ||
| Repayment Tenure of the loan in months: | |||
| EMI in INR: | |||
| Total Repayment (INR) Lakh: | Total Repayment - Interest (INR) Lakh: | ||
An annuity is a series of constant cash payments made over a continuous period. For example, a car loan or a home loan repayment is an annuity. Present value (PV) is a financial function in MS-Excel which calculates the present value of a loan or an investment, based on a constant interest rate. If solves following equation:
PV * (1 + ROI)N_PER + PMT * (1 + ROI * TYPE) * 1/ROI * ( (1 + ROI)N_PER - 1) + FV = 0 where ROI = rate of interest for annuity payment duration (such as monthly in case of EMI), N_PER = Number of re-payments, PMT = payment made each period and cannot change over the life of the annuity (equivalent to EMI), FV = future value or cash balance to attain after the last payment is made, TYPE indicates when payments are due (0 means start of the period, 1 means end of the period).⚉ My Mistakes ⚉
चार्ट पढ़ने के बारे में मेरी कुछ गलतियाँ तथा भ्रान्ति नीचे संक्षेप में दी गई हैं। इनमें से कितने आपको परिचित लगते हैं? Some of the mistakes or misunderstanding I had about reading charts are summarized below. How many of these sound familiar to you?- Guessing or assuming that the price may not move much further if oscillators [RSI and Stochastics] are in (so-called) overbought or oversold zones यह अनुमान लगाना या मान लेना कि ऑसिलेटर्स [RSI और Stochastic] अगर (तथाकथित) ओवरबॉट या ओवरसोल्ड ज़ोन में हैं तो कीमत बहुत आगे नहीं बढ़ सकती है
- Getting fully invested - no [margin] money was left to invest or hedge the position in case trades swung wildly against my positions
- Not waiting for moving averages to cross and price stay below STMA [Short Term Moving Average] few ticks
- Assuming signals for candlestick to be valid for many weeks. As per many authors, the candlestick patterns are valid only for few [2-5] time intervals
- Relying on too many indicators: once I used to follow RSI, MFI, Stochastics, ADX, Bollinger Band and MACD in addition to moving averages
Most of the time, the retail investors behave like the parrots described in this short story.
लघु कथा के अनुसार एक बहेलिया बहुत सारे तोते जाल में फंसा कर ले जाता था। साधु बाबा को ये देखकर बहुत दुख होता था। एक दिन साधु बाबा ने तोतों को शिक्षा देना आरंभ किया। बहेलिया आयेगा, दाना डालेगा, जाल बिछाएगा। तुम जाल में मत फँसना। तोते कुछ ही दिनों में रटने लगे: "बहेलिया आयेगा, दाना डालेगा, जाल बिछाएगा, तुम जाल में मत फँसना"। ये देखकर साधु बाबा बहुत खुश हुए। अब बहेलिया आया दाना डालकर जाल बिछाने लगा। साधु बाबा मन ही मन खुश हो रहे थे। कि मैंने सभी तोतों को शिक्षा दे दी अब तोते जाल में फँसेंगे नहीं। ये सोचते हुए नहाने चले गए। जब साधु बाबा नहाकर लौट रहे थे तभी बहेलिया रास्ते में मिला। बहेलिया के कंधे पर जाल था। जाल में सभी तोते फँसे हुए थे। वे अभी भी रट रहे थे "बहेलिया आएगा, दाना डालेगा, जाल बिछाएगा, तुम जाल में मत फँसना।"
⚡ Caveats ⚡
"Mind freeze" is a very common phenomena when price moves quickly and strongly against your position. You first go into "Hope Mode" and then "Wait Mode" finally exiting at deep losses once you reach in "Fear Mode". जब कीमतें तेजी से और मजबूती से आपकी पोजीशन के खिलाफ चलती हैं तो माइंड फ्रीज होना एक बहुत ही सामान्य घटना है। आप पहले "आशा अवस्था" में जाते हैं और फिर "प्रतीक्षा अवस्था" में एक बार जब आप "डर की अवस्था" में पहुँच जाते हैं तो अंत में बहुत नुकसान होता है।- Do not pay attention to the news, they are to justify the market actions. News has no prediction potential for stock price movement - only higher volatility can be expected when an important news such as quarterly result, RBI monetary policy... are to be announced.
- Credit rating agencies and brokerage house play it safe and may have their own vested interest. It is worth playing opposite to their findings (sell rating implies time is ripe for slow accumulation and vice versa).
- Trading process by its design is a negative-sum game. In other words, trading is always a "win-lose" situation and never a "win-win" or "lose-lose" situation.
- Insider trading is not illegal in its entirety and can be easily circumvented!
- Crashes change the players!
- Failing to plan is planing to fail! However, not all decisions are made with checklists - let your instinct and heuristics take over sometimes.
⊚ Option Trade Stop-Loss Calculator ⊚
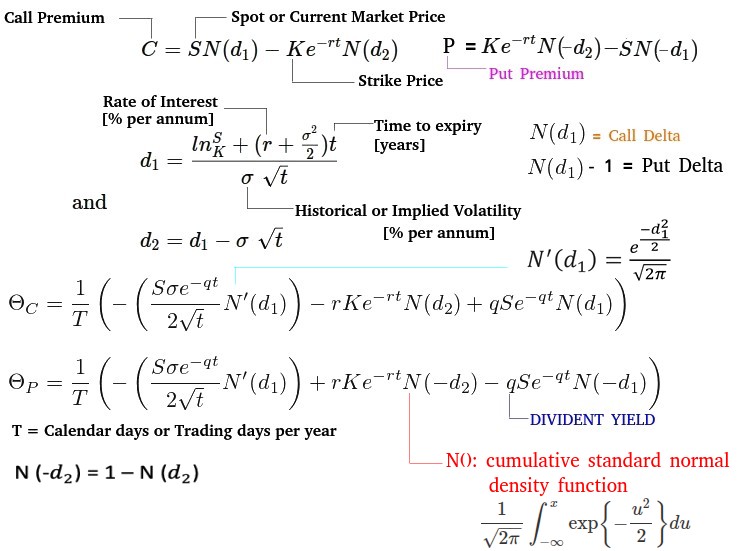
As the premium of an option is not a linear function of spot price of underlying asset, the calculation of stop-loss for option trade needs calculation of delta and gamma at entry price and expected exit price of the underlying asset (stock or index). In the calculator below, the stop-loss level can be used to find exit (take profit level) as well. Dividend Yield is assumed ZERO for this calculator. An uncertainty of 10% has been added to the premium value for exit or stop-loss. One may use upstox.com/calculator/ option-value or at zerodha.com/tools/ black-scholes or from motilaloswal.com/calculators/ option-value-calculator
| Spot Price: | Days to Expiry (days): | ROI: | ||||
| Strike Price: | Option Type | Lot Size | Trade Type | Premium | ||
| Implied Volatility: | Entry Premium: | |||||
| Exit Level: | Delta - Strike: | |||||
| Gamma - Strike: | Approx. Square-Off Premium* | |||||
Note that the delta for call is positive is a sign convection. Actual effect depends on your position: buy or sell. Thus, if you have sold a call option, its delta would be negative in your portfolio and vice versa. Same for put options. This principal is used to make strategies like delta-neutral, delta-positive or delta-negative portfolio or positions.
Note that option pricing is not symmetric for call and put which has been demonstrated in a table in later section of this page.
RRRRR
Rate of Return and Risk-Reward Ratio: How many trades you need to earn a pre-defined monthly income? Refresh page to clear the data. Or update inputs and click Submit to re-calculate. ROCE = Return of Capital Employed. Note that the calculation may not be correct if data entered results in net loss, for example 40% win ratio and risk-reward ration of 1.25 only. Similarly, a win ratio of 50% and risk-reward ratio of 1.0 shall calculate capital required as infinite. To address this issue, the capital requirement and number of trades is calculated only if (Planned Risk-Reward Ratio * Likelihood: % Winning Trade) > 0.50
| Description | UOM | Option - 1 | Option - 2 | Option - 3 |
| Monthly Income Expected* | INR | |||
| No. or Trading Days** | No. | |||
| Willing Risk per Trade | INR | |||
| Planned Risk-Reward Ratio | - | |||
| Likelihood: % Winning Trade | % | |||
| % ROCE per Trade | % | |||
| Output section | ||||
| Number of Winning Trades | No. | |||
| Number of Losing Trades | No. | |||
| Profit from Winning Trades | INR | |||
| Loss from Losing Trades | INR | |||
| EBIT | INR | |||
| Avg. DAILY Trades Required | No. | |||
| Daily Capital Required | INR [Lakh] | |||
| Click on 'Submit' button to update the table | ||||
Beware of Propaganda and Half-Truths Hidden in News: Broking firms, institutions and individual market experts who cannot sense brewing issues in a particular bank say Yesbank in India or SVB in USA will suddenly turn into a maverick fortune-teller and self-proclaimed experts on entire banking industry and immediate outlook. Just think about the propaganda: An obscure and unknown bank (SVB) suddenly became the biggest bank failure in USA history! When the price of a share corrects more than 50% from its peak, the so called market experts shall start advising investors to exit. Try to make a chronological history of the buy/sell recommendations by these "market experts" with the spot price of that share and their sheer propaganda to lure retail investors will become clear.
Economic Propaganda: Profit = Plunder - in reality Profit ≠ Plunder, Inequality = Poverty - in reality Inequality ≠ Poverty. Propaganda: Equality of Opportunity = Equality of Outcome, in real life - Equality of Opportunity ≠ Equality of Outcome. Forecasts: verify key assumptions, key variables considered, money trails, political and/or institutional affiliation of the group making forecasts. Myth: Governments do not need to repay the debts, they need to only service the debt. In reality, one generation or few consecutive generations of tax-payers have to bear the brunt when government chose to waive off the loans. Myth: Government can raise tax revenue. In reality, governments can only raise tax rates, tax brackets and range of taxable items & services.
Trade Lifecycle of Stocks
Let's monitor from start of an IPO (when companies sell certain number of shares at certain price to the public):- X number of shares allotted each to A, B, C, D, E investors at price P0. Total shares= 5X
- A sold it to F at price P1: A's profit/loss = P1 - P0
- D sold it to G at price P2: D's profit/loss = P2 - P0
- F sold it to K at price P3: F's profit/loss = P3 - P1
Delta Calculator
Following entries can be used to calculate delta for up to 5 strike prices for a given spot-price. The default values are: Rate of Interest (ROI) = 5.0% per annum, Implied Volatility = 20 [%] and Dividend Yield = 0 [%]. In order to omit calculation in any row, specify lot size = 0. As an option trader, most of the money is earned through time decay and hence one should try to be delta neutral with only small bias in the anticipated direction of price movement.
| Spot Price: | Days to Expiry (days): | ROI: | ||||
| IV: | Option Type | Lot Size | Trade Type | Output: Delta Values | ||
| Strike Price-1: | Delta-1: | |||||
| Strike Price-2: | Delta-2: | |||||
| Strike Price-3: | Delta-3: | |||||
| Strike Price-4: | Delta-4: | |||||
| Strike Price-5: | Delta-5: | |||||
| Net Delta: | ||||||
In today's [2022] days, most of the brokerage service providers have online tools to calculate Greeks and Margins for options trades. Few screenshots are shared below to show the impact of far OTM covered position on margins required for writing [selling] options.
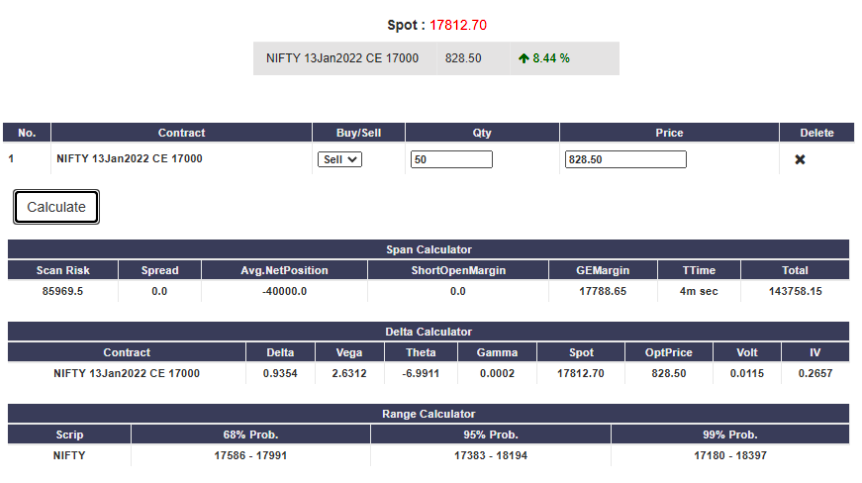
The example above is for naked option short position and the example below is for covered call position.
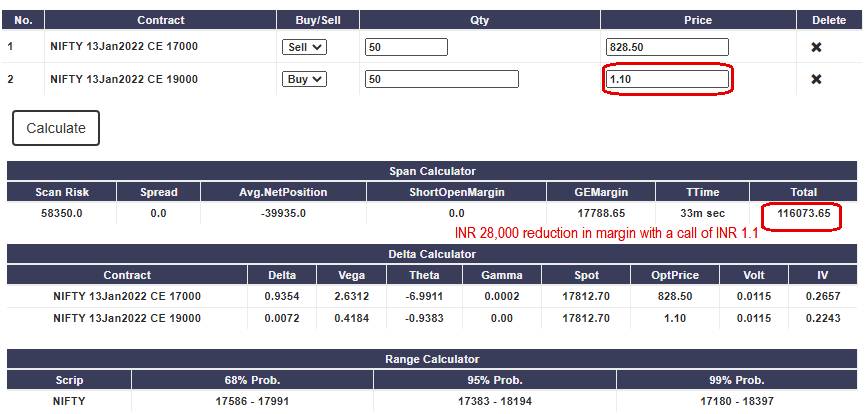
Note that a deep In-the-Money [ITM] option has very poor liquidity [not many buyers/sellers are available and high gap between bid and ask prices] and most of the time trade at discount. Hence, carrying forward such position is like an NPA and should not be traded.
Trading Basics
One should know how to place Limit Orders, Stop-loss Orders, Trailing Stop-Loss Orders and Bracket Orders. If a limit order is partially executed, do not modify and re-order. The new modify order will maintain the original quantity and discard the partially executed quantity. For example, you place limit order to buy 10 numbers of a stock, 5 numbers were bought and then modifying that trade will result in total purchase of 10 + 5 = 15 numbers.
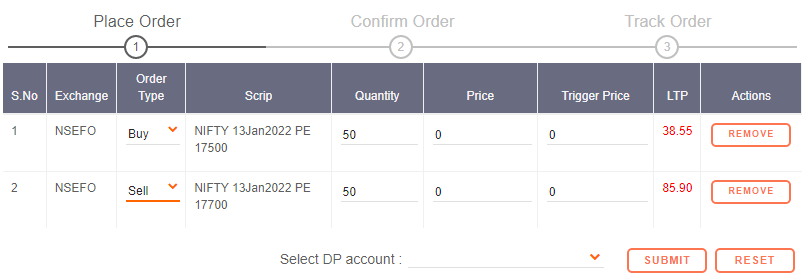
If you are used to place naked options, try to make a rule to place orders in pairs. Specify the limit prices 2-3 Rupees higher or lower (as per the order type) so that both the orders get executed instantly. Check the 1 minute or 5 minute chart to ensure prices are not oscillating much on lower timeframes.
Concepts
Fixed Income Option: Fixed income securities are investment where the cash flows are according to a predetermined amount of interest, paid on a fixed schedule. Popularly known as Debt instrument. In addition to fixed deposits with banks, the different types of fixed income securities include government securities, corporate bonds, Treasury Bills, Commercial Paper. In broader terms Corporate bonds are fixed income securities issued by corporates i.e. entities other than Government. Public sector units, Banks, corporates, Financial Institutions are major issuer of corporate bonds. In NSE, the private placement securities are listed and traded in WDM segment of the Exchange. Public issues are listed and traded in CM segment of the Exchange.- Fixed Rate Bonds:-have a coupon that remains constant throughout the life of the bond.
- Floating Rate Bonds: - Coupon rates are reset periodically based on benchmark rate.
- Zero-coupon Bonds no coupons are paid. The bond is issued at a discount to its face value, at which it will be redeemed. There are no intermittent payments of interest.
The % change in price of bonds is smaller than that of stocks as bond requires definite amount of money to be paid to the bond-holder (less risk) whereas holding stocks of a company merely represents the participation in proportionate fraction in the profits of the company after interest on bonds and dividend on preferential shares issued by the company.
T-Bill is a money market instrument to finance the short term requirements of the Government of India (GOI). The returns on T-Bill instrument shall be difference between the par value and issue price / traded price. T-Bills are issued at discount in primary auction conducted by Reserve Bank of India (RBI). Negotiated Dealing System - Order Matching (NDS-OM) is a platform provided by RBI to trade T-Bills in secondary market. Yield is the income (return) on an investment usually expressed as a % annual return. Yield can be quoted as Yield to Maturity (YTM) = [Par Value - Market Price]/[Market Price] x 365/[Actual Days] or Discount Yield (DY) = [Par Value - Market Price] / [Par Value] x 360/[Actual Days].
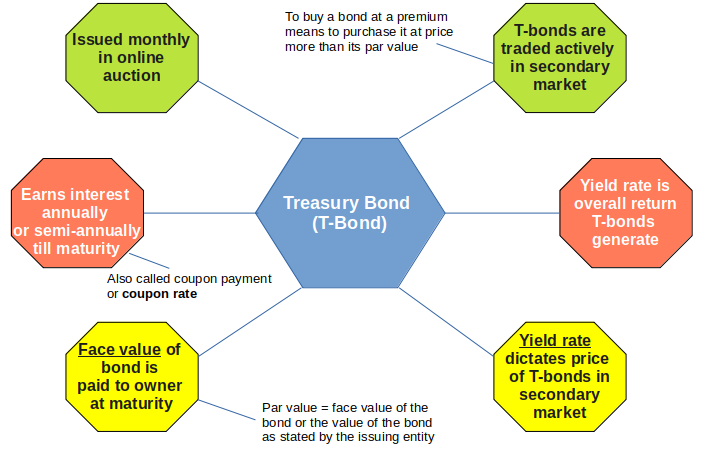
Excerpts from a news article: In Treasury markets, the gap between five-year notes and 30-year bonds fell below 100 basis points after the Fed policy statement to the lowest level since July 2020. A narrower gap could indicate factors like economic uncertainty, easing inflation concerns and anticipation of tighter monetary policy.
Excerpt from Investopedia.com: Treasury bonds (T-bonds) are government debt securities issued by the U.S. Federal government that have maturities of 20 or 30 years. T-bonds earn periodic interest until maturity, at which point the owner is also paid a par amount equal to the principal.
Stock Price Variations
Daily Price Bands
Daily price bands are applicable on securities as below. For Auction market the price bands of 20% are applicable. Scrips on which no derivatives products are available but which are part of Index Derivatives, are also subjected to price bands.- Group-1: Daily price bands of 2% (either way)
- Group-2: Daily price bands of 5% (either way)
- Group-3: Daily price bands of 10% (either way)
- Group-4: No price bands are applicable on scrips on which derivative products are available. In order to prevent members from entering orders at non-genuine prices (typing or data entry errors) in such securities, the Exchange has fixed operating range of 10%.
- Group-5: Price bands of 20% (either way) on all remaining scrips (including debentures, preference shares...).
Data, Data and Data
NSE IPO list from 1999 to 2015: This spreadsheet contains the issue data and issue price.
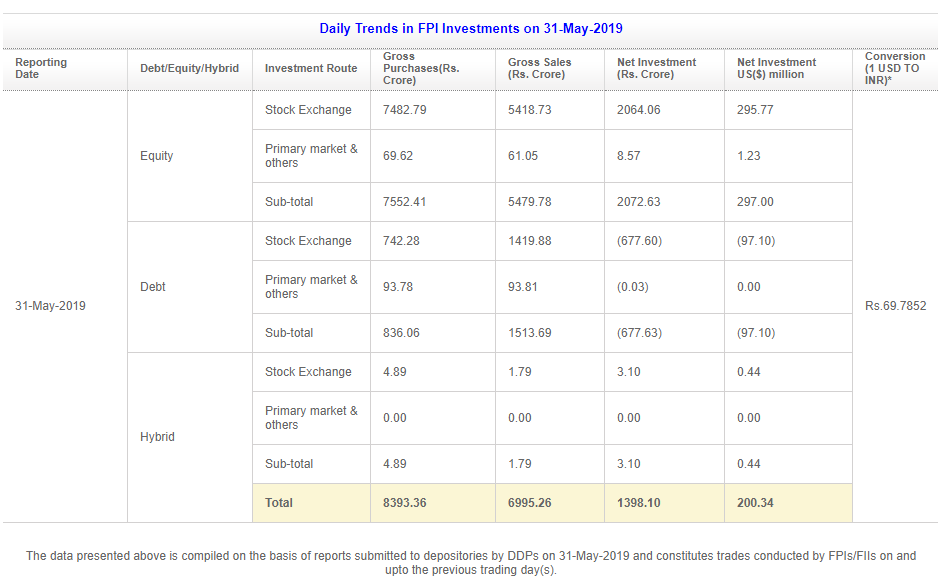
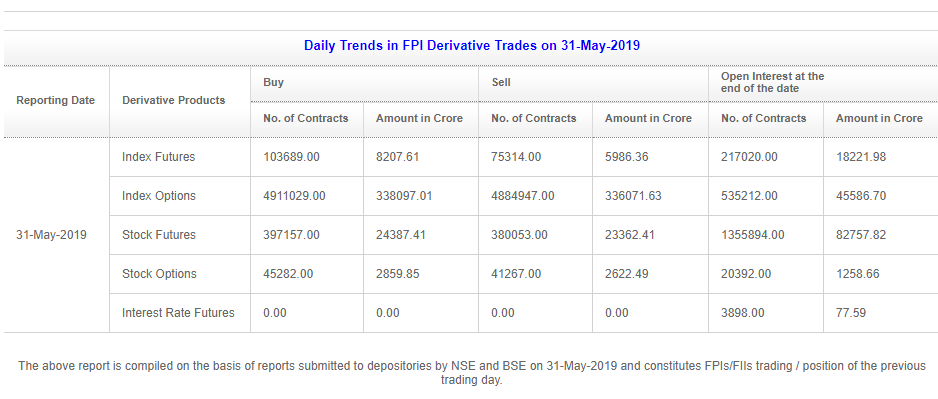
FII-FPI trade data: refer to NSDL website at www.fpi.nsdl.co.in/web/Reports/Latest.aspx.
Since FII and FPI may trade on both NSE and BSE, the turn-over data from NSE may not be sufficient to estimate what fraction of trading volume is contributed by FII/FPI. Refer to the following data for trades on 31-May-2019. 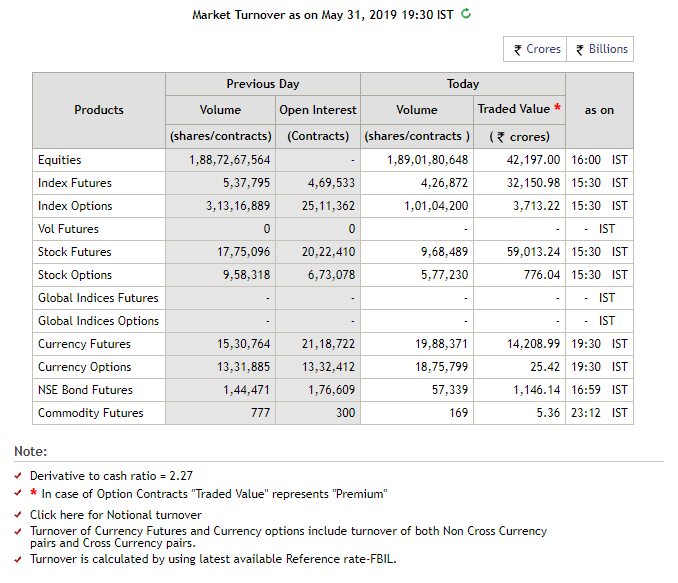
Candlesticks Summary
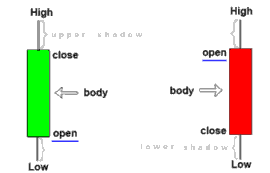
Candlesticks: Work only at Support / Resistance Level and reflect 'personality' of a stock - back testing with historical data is a necessity! Long candles = buy/sell pressure, short = consolidation.
| Candlestick Type | Next Verification Candle | Probability | Anticipated Move |
| Hammer | Gap-up opening next day ending in a Marubozu | High | Bullish Reversal after significant downtrend |
| Morning Star or Abandoned Baby (Evening Star) | Very potent as combination of > 2 candles | High | Reversal after significant trending market |
| Three White Soldier (3 Black Crow) | Doji or Bearish (Bullish) Engulfing | High | Early phase of trend reversal |
| Piercing Candle | First bearish candle with large body, high EOD volume | High | Bullish Reversal after significant downtrend |
| Dark Cloud Cover | Heavy volume during opening of 2nd day | High | Reversal after significant uptrend |
| Long Marubozu / Belt-Hold | Short Marubozu or Spinning Top | Moderate | Trend Reversal / continuation |
| Harami or Petrifying pattern | Gap up near bottom or gap down near top | Moderate | Decrease in momentum |
| Doji | Gap-down opening or formed after long candle | Moderate | Trend interruption / slowing momentum |
| Shooting Star | Gap-down opening next day ending in a Marubozu | Moderate | Bearish Reversal after significant uptrend |
| Bullish (Bearish) Engulfing | Volume on 2nd day, more potent if left stick is a Doji | Moderate | Reversal in trading market |
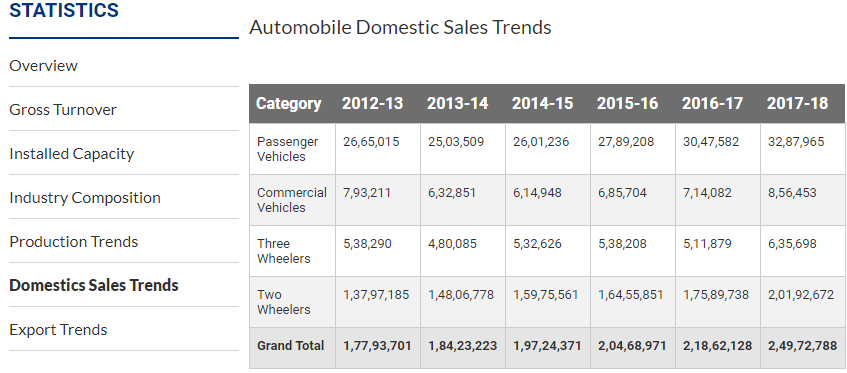
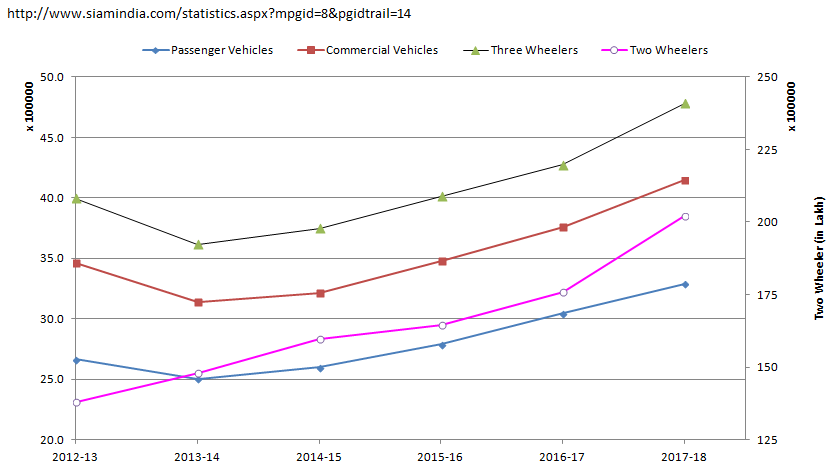
Automotive sales data
Adapted from MOOC: Elements of AI by University of Helsinki
Probability in trading: We all need to guess the market direction and the impact of news on stock prices. From technical analysis perspective, an "informed guess" is analogous of estimating the probability. A key caveat about 'probability' that it is not probability calculus. Instead, it is the ability to think of uncertainty as a thing that can be quantified at least in principle. This means that we can and should be able talk about uncertainty as if it were a number: numbers can be compared ("is this event more probable than that even") and they can often be measured. Measuring probabilities is difficult and not unique method exists: we usually need many observations about a phenomenon to draw conclusions. However, by systematically collecting data, we can critically evaluate probabilistic statements, and our numbers can sometimes be found to be right or wrong. In other words, the key lesson is that uncertainty is not beyond the scope of rational thinking and discussion, and probability provides a systematic way of doing just that.
Elaboration by example:
A pattern analysis forecasts that the price is is going to increase by 2% with 75% probability tomorrow but the day turns out to be drop in price by 1%. Can it be concluded that the forecasting capability of this particular method is not good?We can't conclude that the forecast was wrong based on only single event. The forecast said stock price is going to increase with 70% probability, which means price may drop or increase by lesser percentage with 25% probability or in one out of 4 days. It is reasonable to accept that the day in question was the 1 in 4 event. Concluding that the probability 75% was correct would also be wrong because by the same argument, we could then conclude that 50% chance of price increase by 2% was also correct and both cannot be correct at the same time.
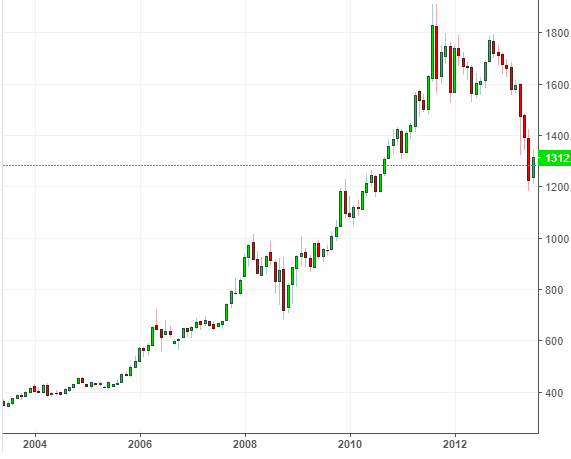
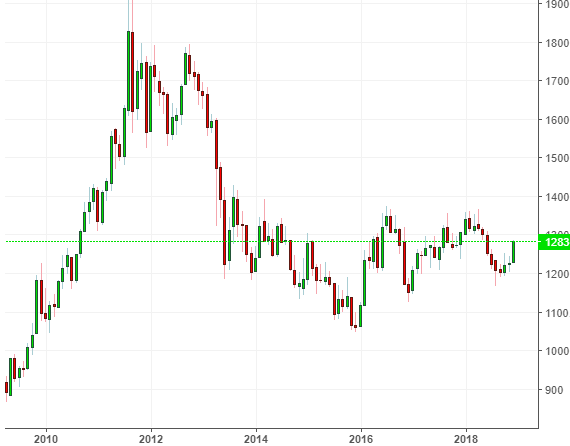
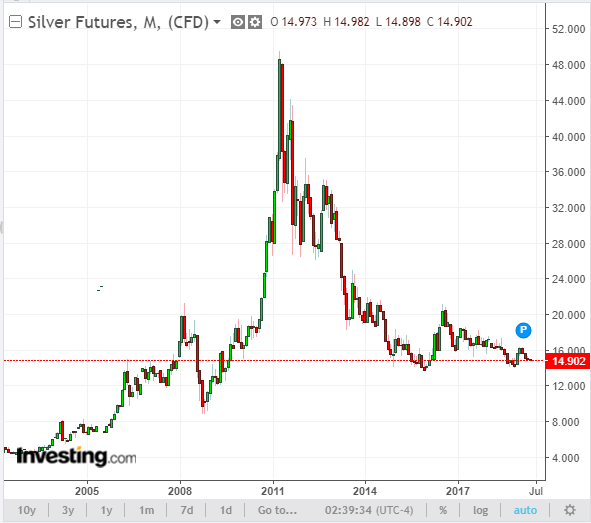
Historical charts of Gold
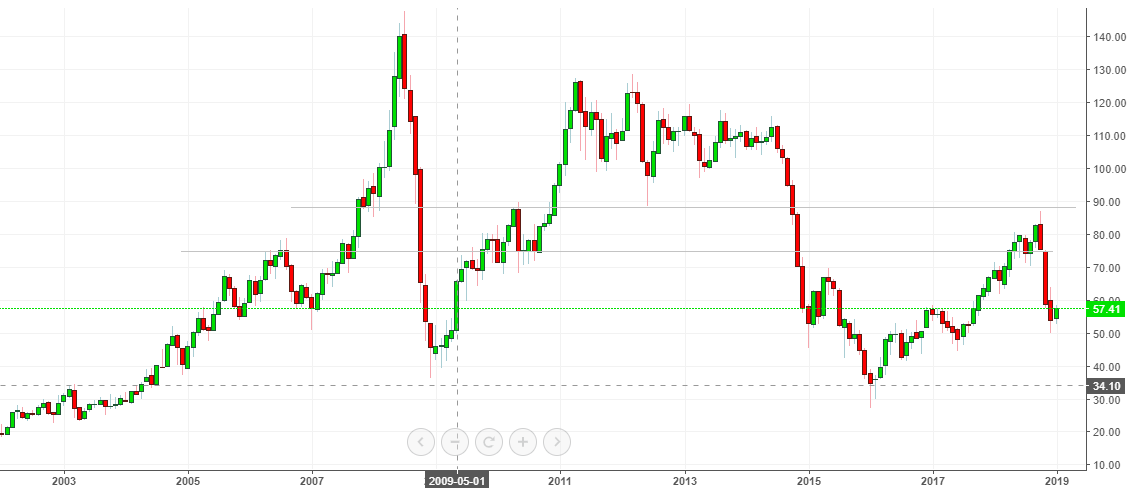
Historical Price of Brent Crude
Historical data of NIFTY50 stocks and description of some MS-Excel based tools are summarized below.
Filters and Scans in Trade Tiger
To filter for unusual activity in futures and option (sharp rise or fall in OI). Unusual option activity before key events typically represent insider information. An increase in CALL option OI at ask-price (seller's price) is bullish, an increase in CALL option OI as bid-price (buyer's price) is bearish. Similarly, an increase in PUT option OI at ask-price (seller's price) is bearish, an increase in PUT option OI as bid-price (buyer's price) is bullish.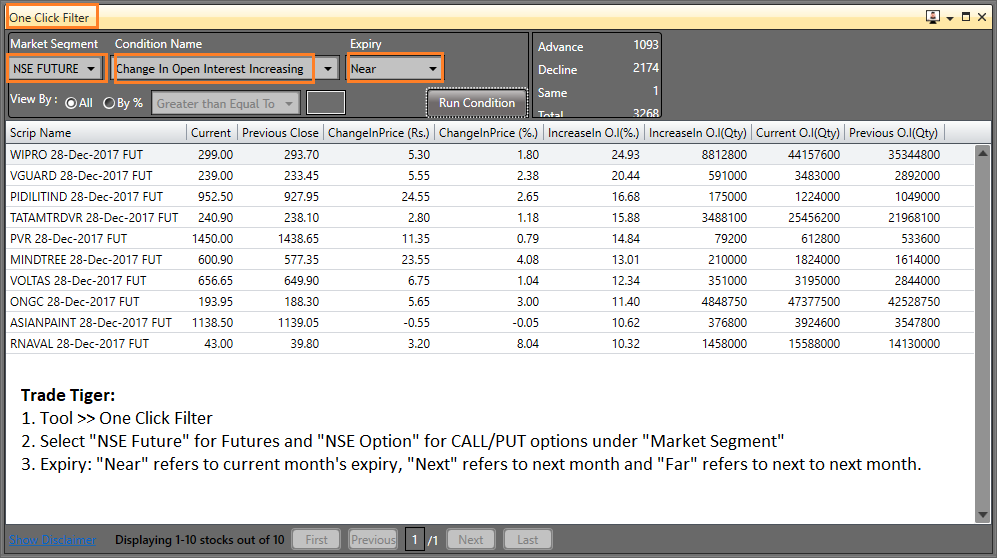
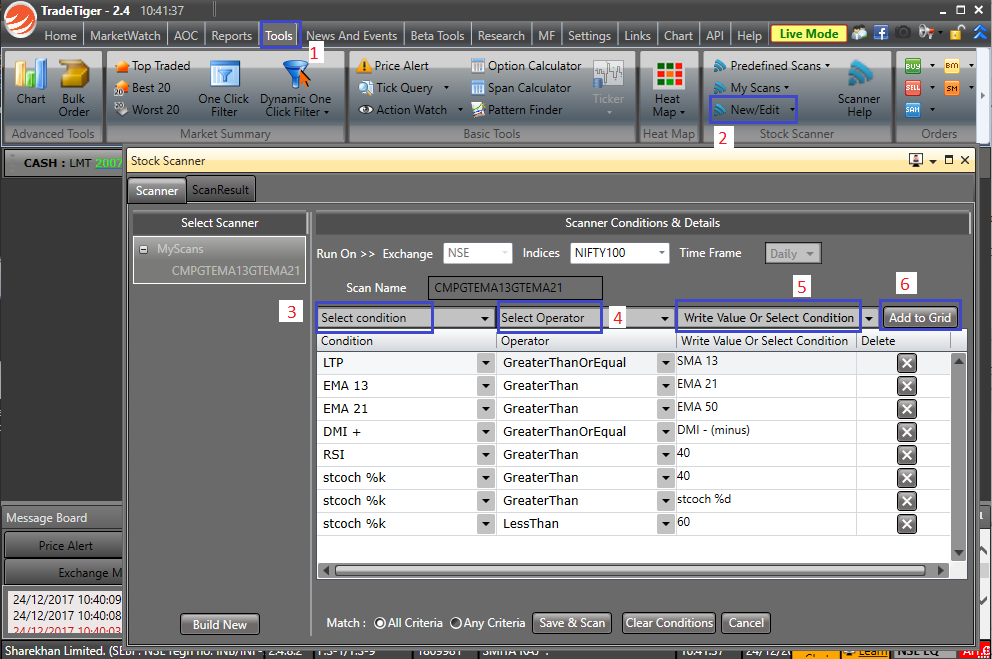
Scan for stock based on your own pre-defined criteria
Some rules of stock market movement:
- The market direction rarely turns on a dime! It takes lot of time and energy to reverse the direction. Investors are like mules who take lot of pain before admitting defeat!
- Stock market and physics: price is displacement, rate of change of price (ROC) is velocity, moving averages are inertia (mass), indicator like RSI is momentum - combined effect of mass and velocity (index - a train moving at slow / high speed, stocks - a motorcycle moving at slow / high speed).
- Trend is your friend until there is bend in the end! If weekly moving average (inertia or mass) is down, a move on daily chart against this direction may be a trap unless key supply zone or resistance levels are broken decisively.
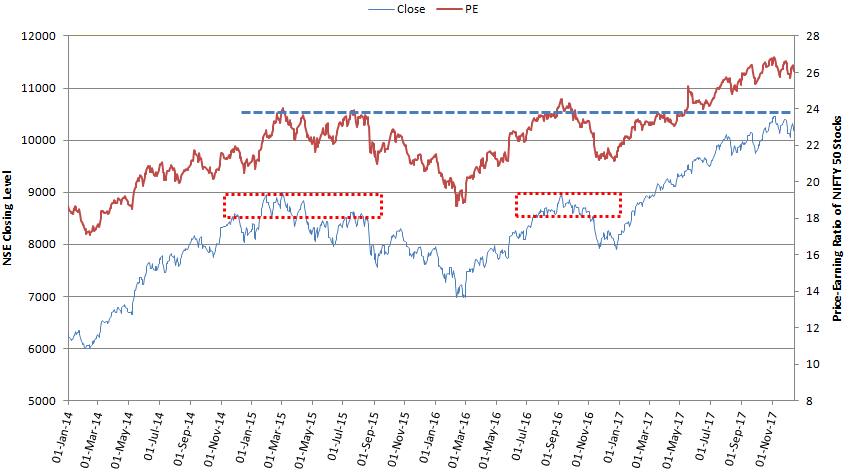
View as on 13-Dec-2017
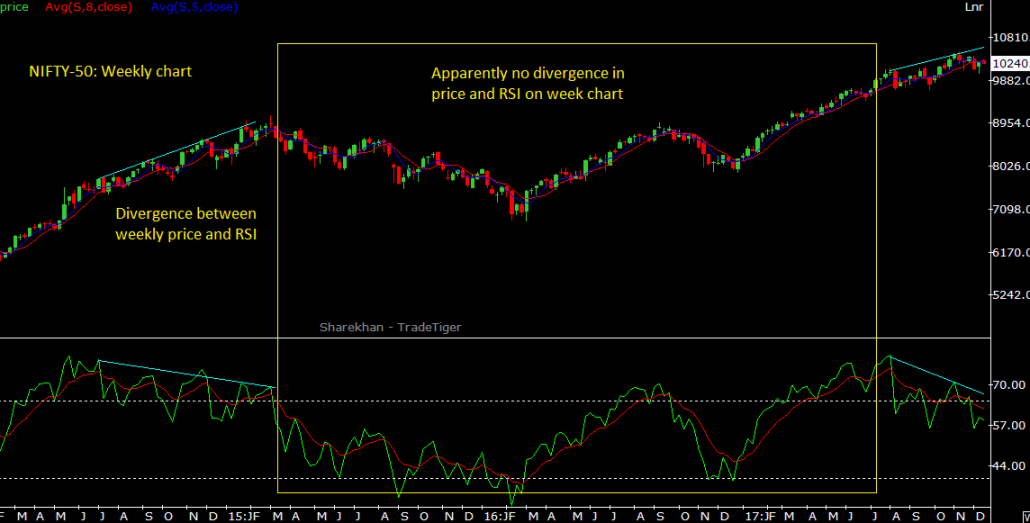
Technical analysis works, but market does retreat to some levels governed by fundamentals specially earning ratios. Combined "price earning ratio" of the stocks comprising the index is one such variable. In very simple terms, if you get 5% interest on your fixed deposits (FD), the PE ratio of your FD is 100/5 = 20. Similarly, if a stock is trading at 1000 Rupees and it generates profit of 20 Rupees per share in a year, its PE ratio is 1000/20 = 50.
Option Trading
There are only following 8 basic purposes of any option trade. One of these will be appropriate depending upon market conditions.
| Option Type | Trade Type | Purpose(s) | |
| CALL | Buy | Speculation: Bullish Outlook | Hedging:
|
| CALL | Sell | Speculation: Bearish Outlook | Hedging:
|
| PUT | Buy | Speculation: Bearish Outlook | Hedging:
|
| PUT | Sell | Speculation: Bullish Outlook | Hedging:
|
Greeks
Delta
δ: The delta of an option is defined as the rate of change of the option price (premium), Π with respect to the rate of change of underlying asset (stock, commodity, FOREX) price, S. Mathematically, δ = dΠ/dS and for small changes in prices, δ = ΔΠ/ΔS. The calculation of option premium based on change in stock price and δ is correct only for small changes in price say up to 5%. For large swing in price the impact of gamma, γ needs to be taken into consideration.
| Option type | Position type | δ |
| Call | Long (Buy) | + |
| Call | Short (Sell) | - |
| Put | Long (Buy) | - |
| Put | Short (Sell) | + |
Gamma
The gamma of an option is defined as the rate of change of δ respected to the rate of change of underlying asset price: Γ = dδ/dS. Thus,change in option premium = δ × change in stock price + 1/2 × Γ × (change in stock price)2
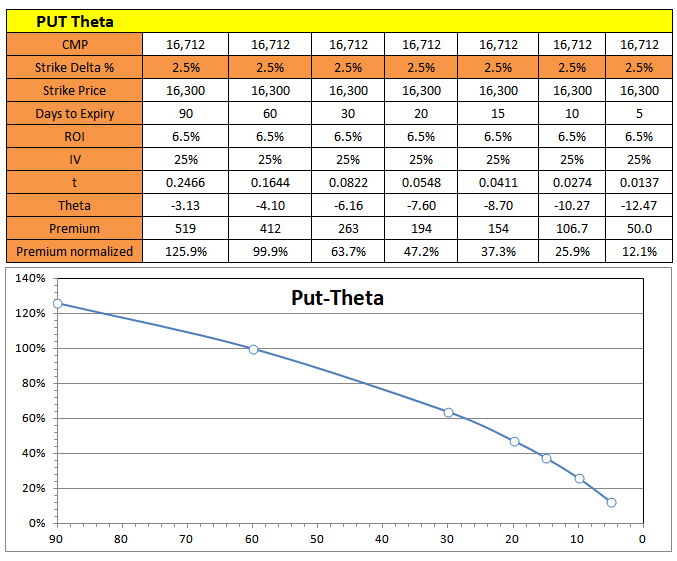
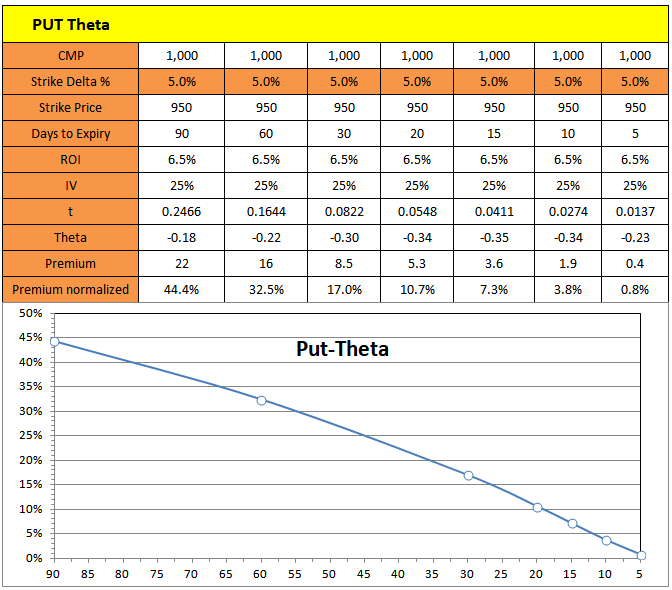
Theta
It is rate of change of the option price (premium) with respective to the passage of time. Following two tables and charts demonstrates the variation of premium (rather the decay in premium) normalized by difference between spot and strike prices.
Application of Greeks. In practice the interaction or trade-off between these parameters is required to correctly estimate the premium and take benefit of expected change in option price.
- Change in stock prices result in higher value of the option price when gamma is positive and large. This means that when there is no change in stock prices, the value of the option will decline towards the expiration date.
- On the other hand, change in stock prices result in lower option value when gamma is negative and large. This means that when there is no change in stock price, the value of the option will increases towards the expiration and theta is positive.
- Hence, a trade-off between gamma and theta should be worked out so that they can be used as proxy for each other in a delta neutral portfolio.
| Outlook | Description | Buy | Buy | Sell | Sell | Remark | L:Lim/U:Unlim, Time Erosion | Profit Probability | Vega Strategy, Desired IV Level | Debit / Credit |
| Bullish | Naked Short Put | - | - | Put | - | ITM / OTM | L / U ! ++ | High: >90% | - Vega | High | Credit |
| Bull Put Spread | OTM Put | - | ITM Put | - | Put credit spread | L / L ! - | High: >90% | - Vega | High | Credit | |
| Long Combo | OTM Call | - | OTM Put | - | U / U ! - | Med: ~50% | - Vega | High | - | ||
| Synthetic Long Call | Stock / FUTR | Put | - | - | Protective put | U / L ! - | Med: ~50% | + Vega | Low | Debit | |
| Synthetic Long | - | Call | Put | - | same strk/maturity | U / U ! - | Med: ~50% | + Vega | Low | - | |
| Bull Call Spread | (ITM) Call | - | (OTM) Call | - | Vert. Bull Spread | L / L ! + | Low: <10% | + Vega | Low | Debit | |
| Call Backspread | (Hi Strk) Call | (Hi Strk) Call | (Lo Strk) Call | - | Ratio Call Spread | U / L ! - | Low: <10% | + Vega | Low | Debit | |
| Naked Long Call | Call | - | - | - | ITM / OTM | U / L ! -- | Low: <10% | + Vega | Low | Debit | |
| Bearish | Naked Short Call | - | - | Call | - | ITM / OTM | L / U ! ++ | High: >90% | - Vega | High | Credit |
| Covered Put | - | - | Stock / FUTR | OTM Put | L / U ! - | High: >90% | - Vega | High | Credit | ||
| Synthetic Long Put | Call | - | Stock / FUTR | - | L / L ! - | Low: <10% | + Vega | Low | Credit | ||
| Bear Call Spread | OTM Call | - | ITM Call | - | Call Credit Spread | L / L ! + | Low: <10% | - Vega | High | Credit | |
| Bear Put Spread | ITM Put | - | OTM Put | - | Vert. Bear Spread | L / L ! - | Low: <10% | + Vega | Low | Debit | |
| Naked Long Put | Put | - | - | - | ITM / OTM | U / L ! -- | Low: <10% | + Vega | Low | Debit | |
| Put Backspread | (Lo Strk) Put | (Lo Strk) Put | (Hi Strk) Put | - | Ratio Put Spread | U / L ! - | Low: <10% | + Vega | Low | Debit | |
| Neutral | Short Straddle | - | - | Call | Put | same strk/maturity | L / U ! ++ | High: >90% | - Vega | High | Credit |
| Short Strangle | - | - | OTM Call | OTM Put | same strk/maturity | L / U ! ++ | High: >90% | - Vega | High | Credit | |
| Long Call Butterfly | ITM Call | OTM Call | ATM Call | ATM Call | L / L ! + | High: >90% | Neutral | Credit | ||
| Short Call Butterfly | ATM Call | ATM Call | ITM Call | OTM Call | L / L ! + | High: >90% | Neutral | Credit | ||
| Iron Condor | ITM Call | OTM Call | ITM Call | OTM Call | L / L ! + | High: >90% | Neutral | Credit | ||
| Covered Call | Stock | - | OTM Call | - | Covered Write | L / U ! + | High: >90% | - Vega | High | Debit | |
| Long Straddle | Call | Put | - | - | same strk/maturity | U / L ! -- | High: >90% | + Vega | Low | Debit | |
| Long Strangle | OTM Call | OTM Put | - | - | same strk/maturity | U / L ! -- | Low: <10% | + Vega | Low | Debit | |
| Covered Strangle | Stock / FTR | - | Sell Call | Sell Put | Stock b/w call/put | L / U ! - | Low: <10% | + Vega | Low | Debit | |
| Collar | Stock / FUTR | Put | Call | - | L / L ! + | Low: <10% | + Vega | Low | Debit |
The adjective 'unlimited' is used to exaggerate the extent of loss or gain and it does not represented mathematical 'infinity'. For example, if you sell a PUT for NIFTY with strike price of 20,000 at premium of INR 100, even if NIFTY reduce by half in that expiry, you loss is limited to (10,000 - 100) x 25 = 2,25,000. Though is is a significantly high multiple of loss or gain (99 times), it is not 'unlimited'. Hence, it is always prudent to trade covered options.
Assymetry in Option Pricing
As you can see from the table, the premium for deep in-the-money (ITM) put options are < the intrinsic values whereas for call options, the option price always remains > the intrinsic value.
| Spot | Strike | IV | ROI | DY | TTE | Premium | Intrinsic Value | ||
| Call | Put | Call | Put | ||||||
| 20,000 | 20,100 | 20.0% | 5.0% | 1.0% | 25 day | 402.45 | 433.74 | 0.00 | 100.00 |
| 20,000 | 20,200 | 356.73 | 487.67 | 200.00 | |||||
| 20,000 | 20,300 | 314.72 | 545.32 | 300.00 | |||||
| 20,000 | 20,500 | 241.48 | 671.39 | 500.00 | |||||
| 20,000 | 21,000 | 114.25 | 1,042.5 | 1,000.0 | |||||
| 20,000 | 21,500 | 47.64 | 1,474.1 | 1,500.0 | |||||
| 20,000 | 22,000 | 17.48 | 1,942.3 | 2,000.0 | |||||
| 20,000 | 23,000 | 1.62 | 2,923.0 | 3,000.0 | |||||
| 20,000 | 24,000 | 0.09 | 3,918.0 | 4,000.0 | |||||
| 20,000 | 25,000 | 0.00 | 4,914.5 | 5,000.0 | |||||
| 20,000 | 19,900 | 505.24 | 337.20 | 100.00 | 0.00 | ||||
| 20,000 | 19,800 | 562.30 | 294.61 | 200.00 | |||||
| 20,000 | 19,700 | 623.10 | 255.75 | 300.00 | |||||
| 20,000 | 19,600 | 687.55 | 220.54 | 400.00 | |||||
| 20,000 | 19,500 | 755.54 | 188.87 | 500.00 | |||||
| 20,000 | 19,000 | 1,142.7 | 77.76 | 1,000.0 | |||||
| 20,000 | 18,500 | 1,589.22 | 5.96 | 1,500.0 | |||||
| 20,000 | 18,000 | 2,068.3 | 6.81 | 2,000.0 | |||||
| 20,000 | 17,000 | 3,058.3 | 0.20 | 3,000.0 | |||||
| 20,000 | 16,000 | 4,054.7 | 0.00 | 4,000.0 | |||||
Type of Shares in US Market
Class-A Shares: traded as common stock with 1 vote/share, Class-B: Founders and other insiders hold them - not publicly traded - 10 votes/share, Class-C: publicly traded but no voting right. Insiders: senior management, board members, people/entities having > 10% of company's stock.Fundamental Analysis
| Company name | Period | Revenue [INR Crores] | PAT [INR Crores] | Number of Employees | Attrition TTM | Operating Margin | Net Margin | Revenue per employee* | Profit per employee* |
| TCS | Q4-24 | 61,237 | 12,434 | 6,01,546 | 12.5% | 26.0% | 20.3% | 10.18 | 2.067 |
| Reliance | Q3-24 | 2,27,970 | 17,265. | - | - | 12.7% | 7.57% |
When you reinvest the sell amount by buying additional shares already existing in your portfolio, the hold value of portfolio shall not increase by the same amount. The increase depends on the hold value of that particular share and buy price of additional shares. Let's understand from an example.
- Assume that portfolio comprise of shares of companies A and B with hold (average buy) prices of 100 and 200 respectively, the quantity of shares are 100 and 250. Total hold price of portfolio = Rs. 60,000
- If shares A are sold at INR 120, sell value is INR 12,000 with profit of INR 2,000
- If full amount is reinvested in shares of company B at INR 150, number of shares added is 12,000/150 = 80
- New hold price of shares of B would be (200 x 250 + 150 x 80) / (250 + 80) = Rs. 187.88 resulting in total portfolio value of INR 62,000
- Thus, the portfolio value shall increase or decrease by the profit or loss reinvested and not the total amount reinvested.
Buying a House
Various components of the total price of a house:- Basic Cost of the Property: land and construction costs (excluding profit margin charged by developer)
- Stamp Duty and Registration Charges
- Goods and Services Tax: GST is applicable on purchase of under-construction properties. Ready-to-move-in flats are generally exempt from GST, which can be an important factor to consider during price calculation - reference: sobha.com/blog/total-cost-of-buying-a-flat-in-bangalore
- Home Loan Processing and Interest Costs
- Brokerage Fees
- Legal and Documentation Charges: one should go through a lawyer to validate the legality of claims made by developer
- Parking and Clubhouse Charges
- Maintenance and Sinking Fund Charges
- Basic Interior Furnishing Costs(Optional but Common)
- Preferential Locality Charge (PLC): applies to flats with special attributes such as higher floors, park-facing positions, corner units, or scenic views - based on developer policies and market demand.
Land Measurement System
One Dismil is equivalent to 435.6 square feet. Note that the size of localized units used for land measurement varies from state to state in India.1 Dismil = 0.01 killa = 0.31 kattha = 6.4 dhur
1 kattha / कट्ठा = 3.125 decimal or Dismal, 1 Katha (कठ्ठा) = 20 Dhur (धुर) = 338.63 m² = 3645 sq. ft.
1 acre = 4,047 [m2] = 43,560 [ft2] = 1.60 bigha / बीघा1 bigha = 62.51 dismil = 400 [dhur] / वर्ग धुर = 20 [kattha] = 27,220 [ft2] = 3025 sq. yard वर्ग गज
1 hectare = 10,000 [m2] = 1,07,639 [ft2] = 3.954 bigha / बीघा = 79.1 कट्ठाKewala: In the context of land ownership in Bihar, it refers to the land registry copy, a document owner receives after registering land in a registry office. अगर आपके पास केवाला अर्थात दस्तावेज कॉपी नहीं है तो, उस जमीन पर आपका कोई अधिकार नहीं रहेगा। इसलिए जब भी कोई भी व्यक्ति जमीन खरीदता है या उसके कोई पूर्वज पहले ही जमीन खरीद रखे हैं तो, उस जमीन को लेकर उसके पास दस्तावेज अर्थात केवाला होना अति आवश्यक होता है। क्योंकि अगर जमीन का केवल वाला नहीं होगा तो, आप उस जमीन पर अपना दावेदारी नहीं दिखा पाएंगे
दाखिल ख़ारिज: देश के किसी भी राज्य में संपत्ति का हस्तांरण एक क़ानूनी प्रक्रिया के तहत उसके कानूनी हकदार को ट्रांसफर किया जाता है। इसके तहत परिवार के मुखिया जिसके नाम पर भूमि है, को हटा कर उसके पुत्र अथवा पुत्री का नाम लैंड रिकॉर्ड में दर्ज करवाया जाता है. इसी प्रक्रिया को ही दाखिल ख़ारिज कहा जाता है. दाखिल खारिज प्रॉपर्टी म्यूटेशन का हिंदी शब्द है। यह दूसरों के नाम पर संपत्ति हस्तांतरण की प्रक्रिया है।
परिमार्जन: जमीन में सुधार की प्रक्रिया को परिमार्जन कहा जाता है। आपको अगर अपनी जमीन से संबंधित जैसे दाखिल खारिज में सुधार, जमाबंदी में सुधार, नाम पते में सुधार, खसरा, रकबा, लगान आदि में किसी भी तरह की समस्या का सामना करना पड़ता है तो परिमार्जन पोर्टल पर इसका हल मिल जाएगा। रजिस्ट्री सिर्फ ओनरशिप ट्रांसफर करने का काम करती है जबकि इसके बाद स्वामित्व देने का काम दाखिल-खारिज से होता है. जमीन की रजिस्ट्री के बाद लगभग 3 महीने के अंदर दाखिल खारिज के लिए तहसील में आवेदन देना अनिवार्य है। यदि जमीन की रजिस्ट्री कराए हुए काफी साल हो गए हैं और आपने अभी तक दाखिल खारिज नहीं करवाया है तो ऐसी कंडीशन में तहसीलदार आपकी जमीन का दाखिल खारिज करने से इनकार कर सकता है।
Land Possession Certificate (LPC), DCLR stands for Deputy Collector Land Reform. cadastral: (of a map or survey) showing the extent, value, and ownership of land, especially for taxation. Map Type: RS = Revisional Survey or Residential Suburban or Revisional Settlement, CS Map = Cadastral Survey Map. Sometimes CS means Central Settlement of 1926 and RS means Revisional Settlement of 1962. Thus, RS Map is expected to be more accurate than CS type.
रैयत एक ऐसे व्यक्ति को संदर्भित करता है जिसने सीधे सरकार के अधीन भूमि धारण करने का अधिकार प्राप्त किया है, चाहे वह धारा 44 के आधार पर या अन्यथा, मुख्य रूप से स्वयं या अपने परिवार के सदस्यों द्वारा या नौकरों की सहायता से या मजदूर, या भागीदारों या बरगदारों की सहायता से इसे खेती करने के उद्देश्य से प्राप्त किया हो।
गैरमजरूआ जमीन: वैसी जमीन जो विगत सर्वे में किसी भी रैयत को बंदोबस्त नहीं की जा सकी उसे ही गैरमजरूआ जमीन कहा जाता है। गैरमजरूआ जमीन दो तरह की होती है। गैरमजरूआ आम और खास। गैरमजरूआ आम पूर्ण रूप से सरकारी रास्ता, पहाड़ या सैरात होती है। इसकी खरीद-बिक्री नहीं हो सकती।
मौजा (Mouza) एक प्रकार के प्रशासनिक जिले या विशिष्ट भूमि क्षेत्र को रेफर करता है। यह एक प्रकार से भूमि की यूनिट की भौगोलिक अभिव्यक्ति (expression) होती है जिसका इस्तेमाल राजस्व एकत्र करने के लिए किया जाता था। सरल शब्दों में मौजा को हम गांव भी कह सकते हैं। भारतीय गांवों में एग्रीकल्चर एक्ट सीलिंग एक्ट पारित हुआ, जिसे 1970 से लागू किया गया। इसके बाद मौजा का नाम बदलकर ग्राम-तहसील कर दिया गया, जिसका नियंत्रण संबंधित राज्य के जिला कलेक्टर द्वारा किया गया।
जमाबंदी: इस रिकॉर्ड में इस बात का विवरण शामिल है कि जमीन का मालिक कौन है, कितनी जमीन है, किस अनुपात में इसका मालिक है, जमीन पर किसके पास अधिकार है, और जमीन से जुड़े अन्य हालिया घटनाक्रम हैं। यह दस्तावेज़ एक पटवारी द्वारा बनाया जाता है तथा राजस्व अधिकारी द्वारा सत्यापित किया जाता है।
खसरा संख्या (Khasra Number) भारत के भूलेखों (Land Record) में इस्तेमाल होने वाला शब्द है। खसरा (Khasra) एक फारसी शब्द है। इसे DAG संख्या के नाम से भी जाना जाता है। यह एक विशिष्ट संख्या है जो गांवों में स्थित जमीन के लिए निर्धारित की जाती है। शहरी क्षेत्रों में सर्वे नंबर या प्लॉट नंबर दिया जाता है। जब आप भूमि रिकॉर्ड को ऑनलाइन या ऑफलाइन एक्सेस करते हैं, तो आप आम तौर पर खसरा नंबरों पर आते हैं। खसरा नंबर राजस्व विभाग के अधिकारियों द्वारा सौंपा गया है। उस गाँव में उपलब्ध भूमि के प्रत्येक पार्सल को एक खसरा संख्या (Khasra Number) निर्दिष्ट करने के लिए गाँव का नक्शा लिया जाता है। किसी प्रॉपर्टी पर अपना अधिकार करने के लिए खसरा संख्या होना एक आवश्यक दस्तावेज है।
खाता संख्या, जिसे खेवट संख्या (Khewat number) के रूप में भी जाना जाता है, ऐसी संख्या है जो जमीन के उन मालिकों को सौंपी जाती है जो संयुक्त रूप से भूमि के किसी हिस्से के मालिक होते हैं। खाता संख्या भूस्वामियों और उनकी कुल जोत का विवरण प्रदान करता है। भू-स्वामित्व बदलने के साथ, खाता संख्या बदल जाती है। जैसे - दो भाई जिनका खेवट 4 में संयुक्त स्वामित्व है और जो खेवट 3 में जमीन के मालिक को जमीन बेचने का फैसला करते हैं। दाखिल खारिज के बाद, नए मालिक का नाम खेवत 3 और खेवत 4 में अपडेट किया जाएगा।
खतियान (खतयोनि) शब्द से बना है । खतियान का अर्थ होता है कि खेतीबाड़ी से जुड़ा दस्तावेज, खतियान शब्द खेतीयानी से मिलकर बना है। Bihar Khatiyan एक ऐसा दस्तावेज होता है जिसमें अपनी जमीन एवं मौजे का पूरा वर्णन होता है। इसके साथ इसमें खतियान धारी किसान के नाम, पिता का नाम,मौजा(गांव) का नाम,जाति,थाना नंबर,अंचल का नाम, जिला का नाम,राज्य का नाम,खाता नंबर,खेसरा नंबर (प्लाट नंबर),जमीन (खेत) के चौहद्दी, जमीन का दखल और दखल का स्वरुप,नवैयत/जमाबंदी नंबर, जिस कागज (दस्तवेज) पर ये पूरा विवरण लिखा रहता हैं उसे खतियान कहते हैं। CS Khatiyan: It is called Cadastral Survey. Documents prepared through survey for the purpose of determining possession, ownership and assessing Land Development Tax is known as Khatiyan. 1) It is also known as Record of Rights, 2) it does not confer any title to property. CS Khatiyan: This khatiyan was prepared on 1888 and ends on 1940 known as Cadastral Survey. RS Khatiyan: After 50 years of CS survey another survey was held on. This survey was known as Revisional Survey and the khatiyan made from this survey is known as RS Khatiyan. The purpose of this survey was to update the amount of land, owner’s name and possessor’s name. It is more authentic than the CS khatiyan.
खतौनी संख्या उन काश्तकारों को सौंपी जाती है जो अलग-अलग खसरा संख्या वाले जमीन के हिस्से में फसल उगाते हैं। यह काश्तकारों और उनके द्वारा खेती किए जाने वाले क्षेत्र का पूरा विवरण देता है। यदि भू स्वामी भूमि जोतता है, तो उसे भूलेखों में स्व-खेती की गई भूमि के रूप में दर्ज किया जाता है।
भूलेख (Bhulekh) संस्कृत का एक शब्द है जिसका अर्थ भू+आलेख (Bhu+Alekh) है। भू का अर्थ है भूमि तथा आलेख का अर्थ रिकॉर्ड है। भारत में भूलेख सिंधु सभ्यता जितनी पुरानी है। भारत सरकार ने स्वतंत्रता के बाद से ही भूलेखों को बनाए रखा है। इसे व्यवस्थित तथा यूजर अनुकूल बनाने के लिए, सरकार ने 1988-89 में भूलेखों का कम्प्यूटरीकरण (CLR) शुरु किया। इसके बाद 2008 में, भूलेखों के प्रबंधन में पारदर्शिता लाने हेतु सरकार द्वारा राष्ट्रीय भूलेख आधुनिकीकरण कार्यक्रम (NLRMP) शुरू किया गया था। हर राज्य की अपनी भूलेख वेबसाइट होती है जो संबंधित राज्य सरकार द्वारा संचालित की जाती है।
Kaithi or Kayathi Script
It is a historic Brahmic script used across Northern and Eastern India (modern Bihar, Uttar Pradesh) from at least the 16th century, primarily for legal, administrative, and private records. Refer the book "A Handbook to the Kaithi Character" by Grierson, George Abraham (1881).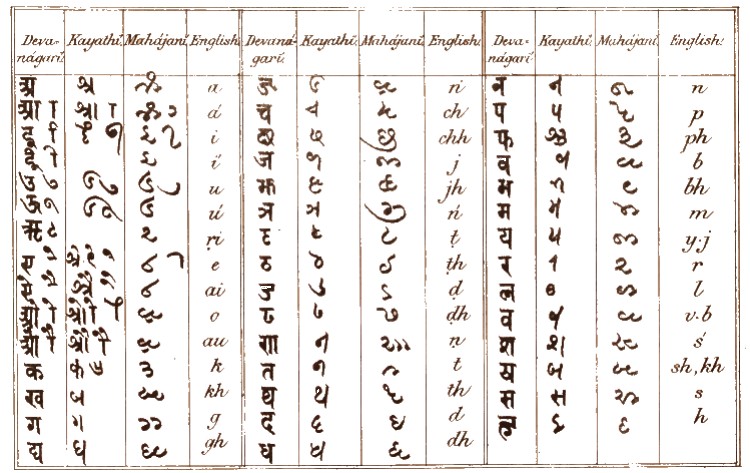
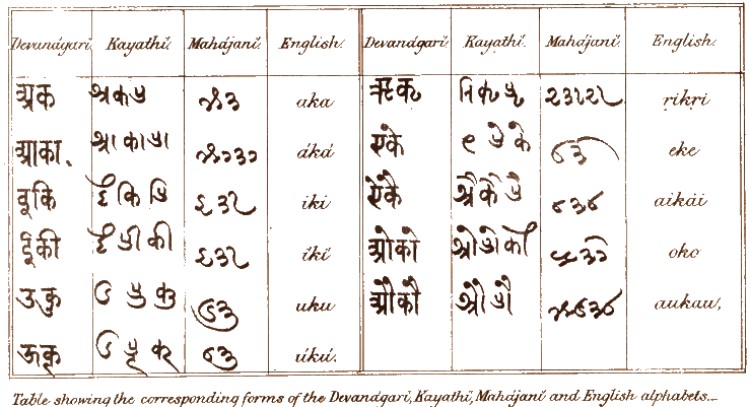
Examples of Documents written in Kaithi Script
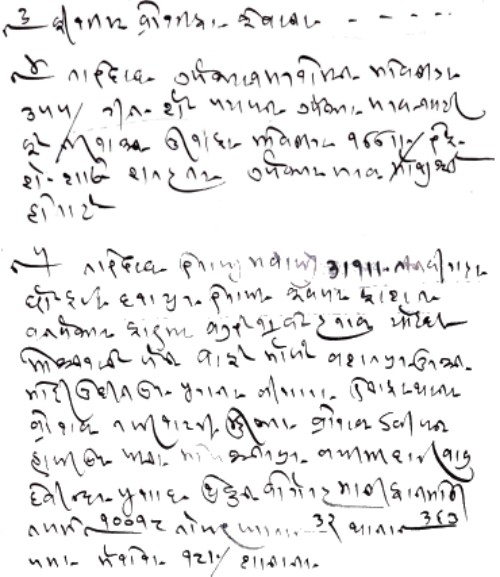
Dirty Money Market
No body knowns how much money was lost in collapse of Lehman Brothers. Saudi Arabia’s Saudi National Bank invested about $1.4 billion for a 10% stake in Credit Suisse in late 2022, making it Credit Suisse’s largest shareholder. March 2023: Switzerland’s regulatory authorities allowed the takeover of Credit Suisse by UBS without the shareholder approval of either entity. Credit Suisse has two anagrams: Credit Issue and Suit is Cursed. Even frauds are made a respectable activity - this company used to be in list of Forbes and Fortune 500 company for many years. 2012: rank-204, 2018: rank-373.Frauds in US Stock Market depicted in Charts
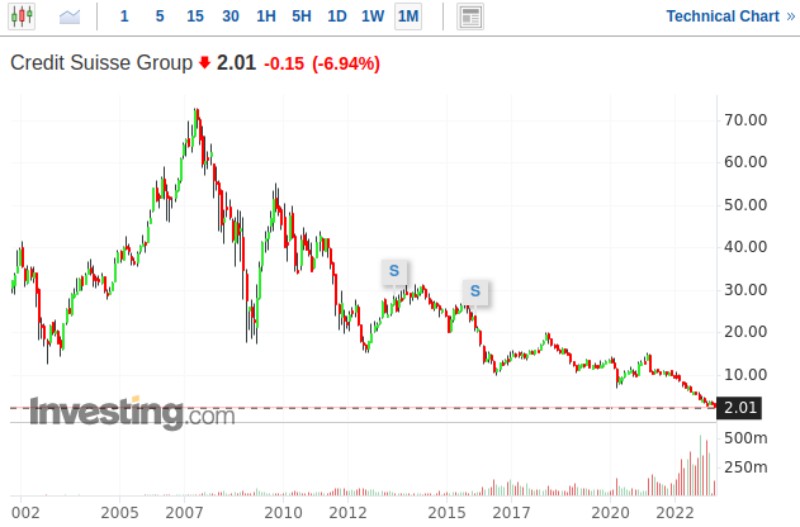
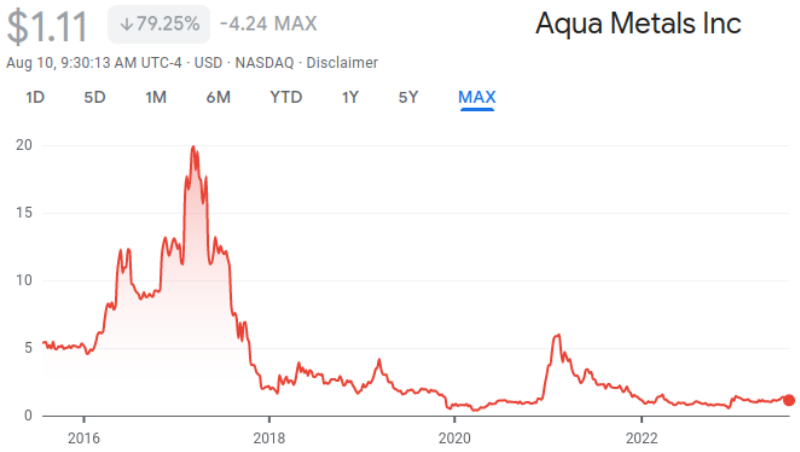
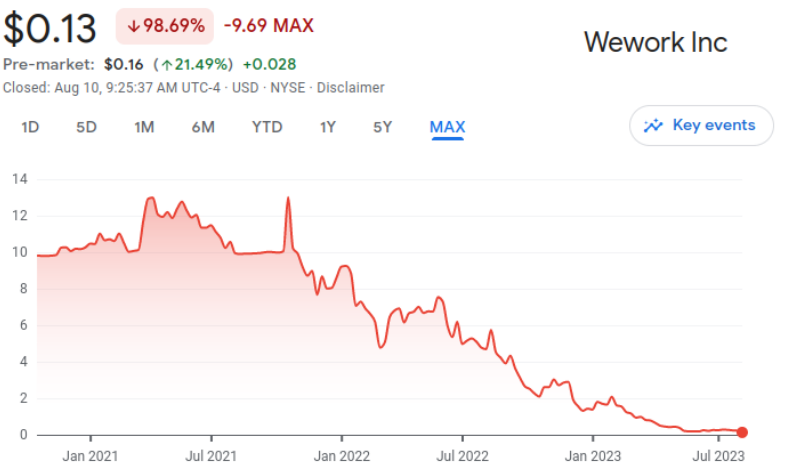
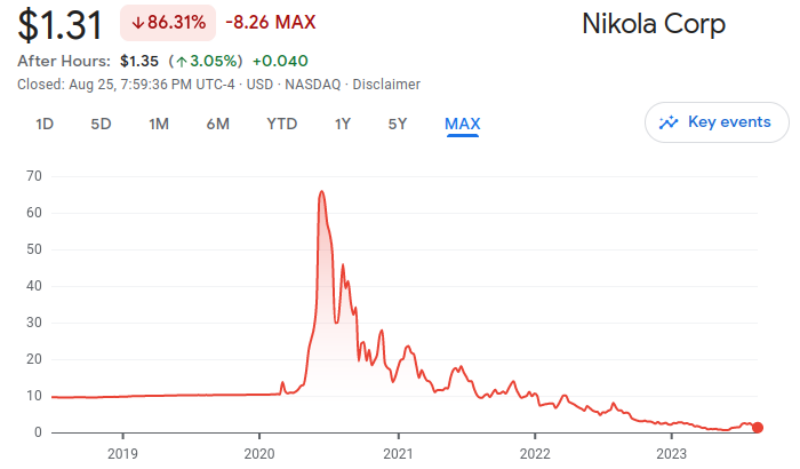
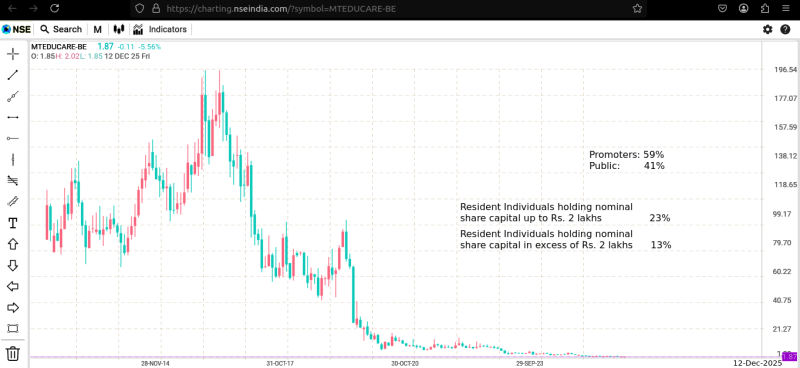
Net Return on Investments
This is a simple calculator to estimate annual rate of return on any business-like activity. All values are in INR Lakh. p.a. = Per Annum or per year. Close the browser and re-open the page if the output fields get printed with garbage values.
| Initial Cost of Land in [INR Lakh]: | Capital investment in construction* [INR Lakh] | ||
| Yearly operational cost on durables1: | Yearly manpower cost2: | ||
| Revenue per year: | Sales and marketing cost: | ||
| Amount of loan taken: | Rate of interest for loan [%]: | ||
| Duration of loan repayment [years]: | Tax benefit on loan interest payment4 [%]: | ||
| Life of the building [years]: | Average inflation rate over the life [% p.a.]: | ||
| Rate of increase in land price [% p.a.]: | Expected cost of demolition [INR Lakh]: | ||
| (Perceived) average rental income* [INR Lakh/year]: | Capital gain tax [%]: | ||
| Operating profit before tax per year | Operating margin [%]: | ||
| PBT with depreciation | Profit margin with depreciation3 | ||
| Land price (value) at end of life [INR Lakh]** | Net return (PAT) end-of-life [INR Lakh]#: | ||
*put zero if no rent income - value taking into account maintenance and taxes **adjusted based on inflation rate, #including (actual / notional) rental value - at the end of period chosen by "Life of Building", value is adjusted (reduced) by rate of inflation.
Story of Boom and Doom in Charts
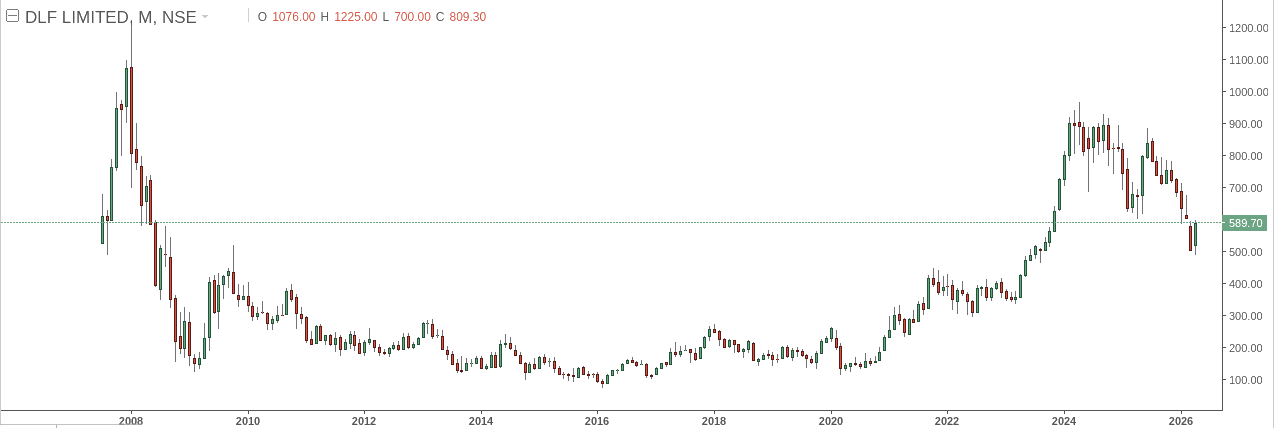
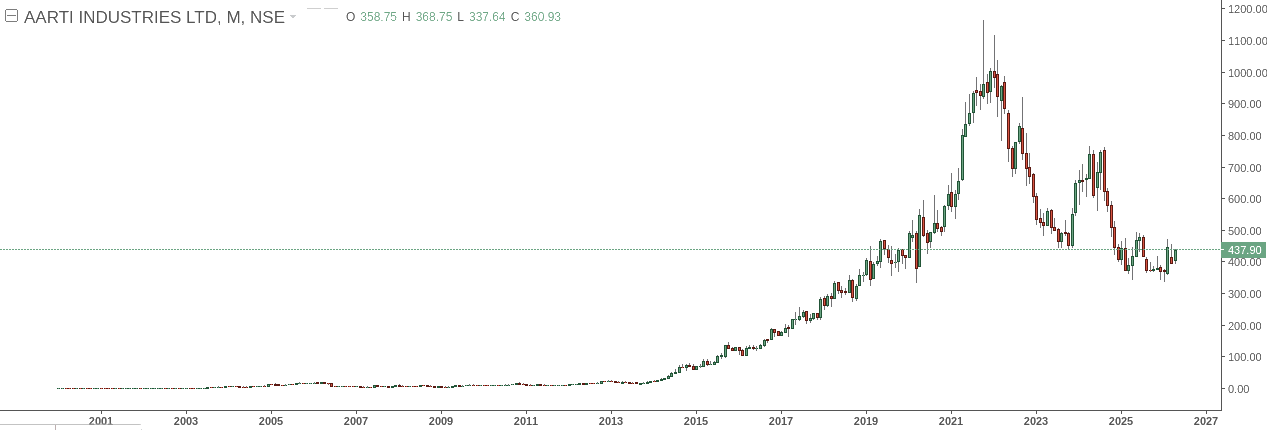
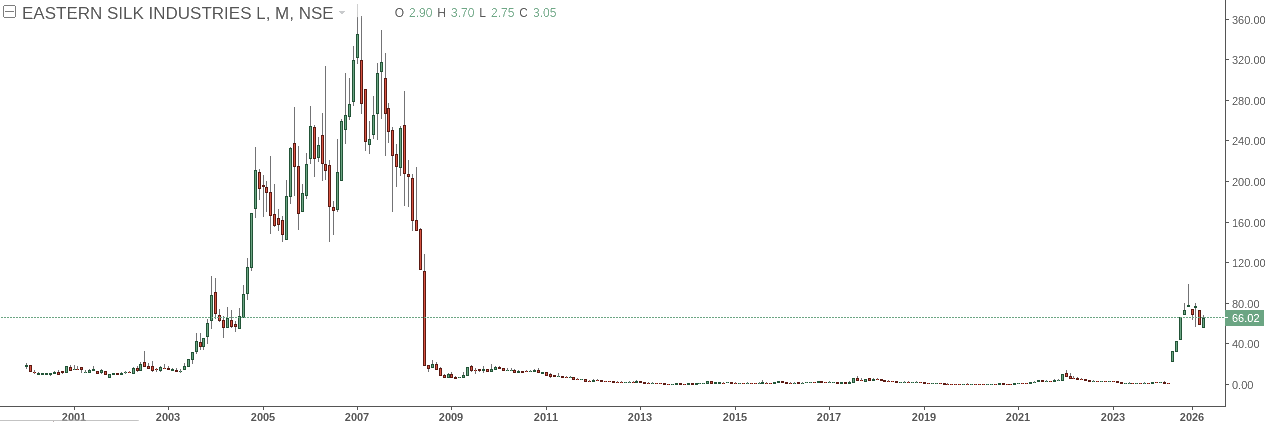
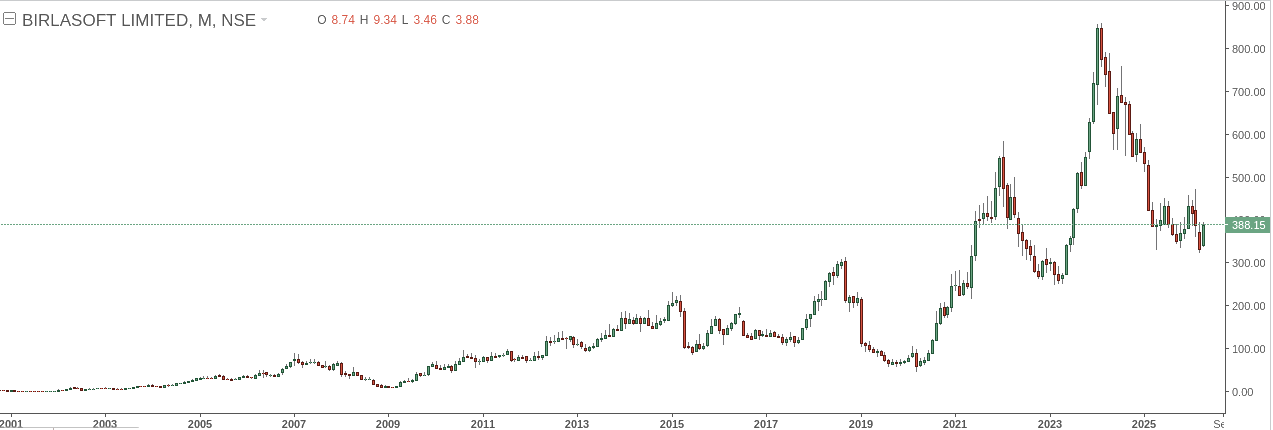
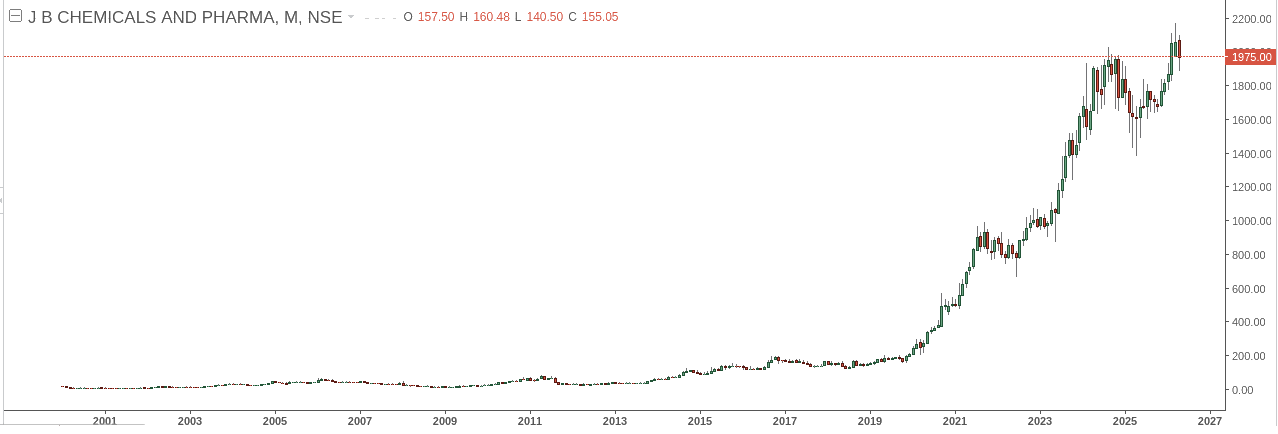
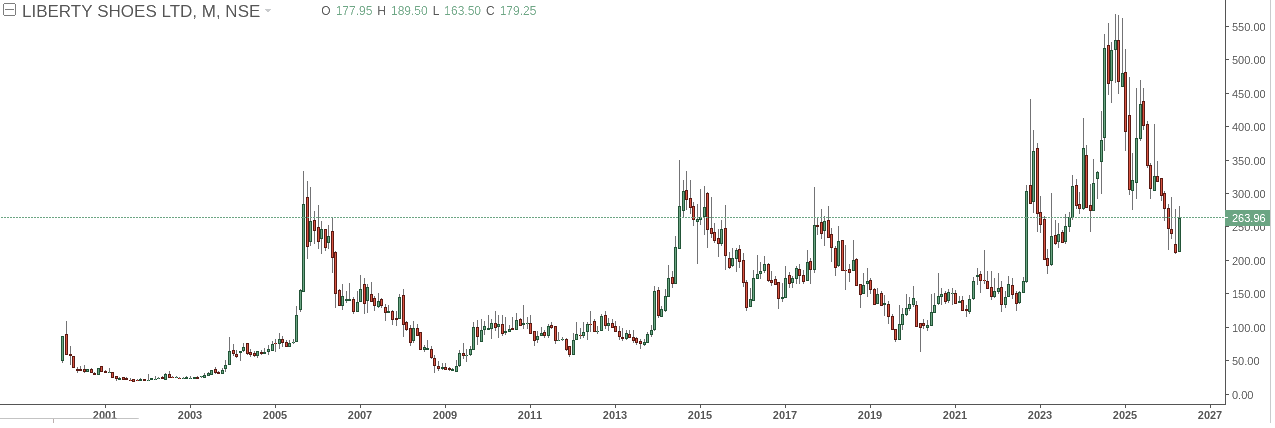
The content on CFDyna.com is being constantly refined and improvised with on-the-job experience, testing, and training. Examples might be simplified to improve insight into the physics and basic understanding. Linked pages, articles, references, and examples are constantly reviewed to reduce errors, but we cannot warrant full correctness of all content.
Template by OS Templates